微服务架构上通过业务来划分服务的,通过REST调用,对外暴露的一个接口,可能需要很多个服务协同才能完成这个接口功能,如果链路上任何一个服务出现问题或者网络超时,都会形成导致接口调用失败。随着业务的不断扩张,服务之间互相调用会越来越复杂,在项目中引入sleuth可以方便程序进行调试。
Spring Cloud Sleuth为服务之间调用提供链路追踪。通过Sleuth可以很清楚的了解到一个服务请求经过了哪些服务,每个服务处理花费了多长。从而让我们可以很方便的理清各微服务间的调用关系。此外Sleuth可以帮助我们:
- 耗时分析: 通过Sleuth可以很方便的了解到每个采样请求的耗时,从而分析出哪些服务调用比较耗时;
- 可视化错误: 对于程序未捕捉的异常,可以通过集成Zipkin服务界面上看到;
- 链路优化: 对于调用比较频繁的服务,可以针对这些服务实施一些优化措施。
改造前面的feign、service(服务)
pom增加:
<!--sleuth跟踪-->
<dependency>
	<groupId>org.springframework.cloud</groupId>
	<artifactId>spring-cloud-starter-sleuth</artifactId>
</dependency>
feign增加日志:
@Autowired
    private IFeignService feignService;
    private static Logger log = LoggerFactory.getLogger(FeignController.class);

    @RequestMapping("/index")
    public String index(){
        log.info("feign info"); return feignService.index();    // @FeignClient(value = "service-hello")
}
service增加日志:
private static Logger log = LoggerFactory.getLogger(HelloController.class);
@RequestMapping("/index")
public String index() {
log.info("service info");
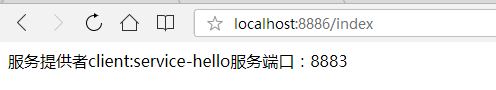
System.err.println("服务提供者client:" + name + "服务端口:" + port);
return "服务提供者client:" + name + "服务端口:" + port;
}
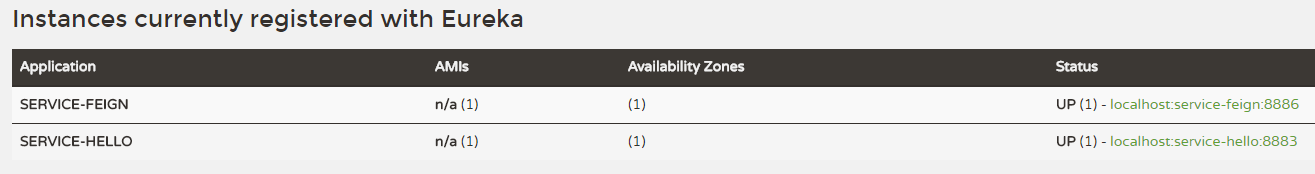
启动测试
2018-12-29 16:24:26.048  INFO [service-feign,1d270312e94cab85,1d270312e94cab85,false] 10692 --- [nio-8886-exec-8] c.e.fegin.controller.FeignController     : feign info

2018-12-29 16:24:26.056  INFO [service-hello,1d270312e94cab85,5e23c30b75ee6755,false] 6560 --- [nio-8883-exec-5] c.e.e.controller.HelloController         : service info
日志中类似
[appname,traceId,spanId,exportable],也就是Sleuth的跟踪数据。其中:
- appname: 为微服务的服务名称;
- traceId\spanId: 为Sleuth链路追踪的两个术语,后面我们再仔细介绍;
- exportable 是否是发送给Zipkin
链接:https://www.jianshu.com/p/c3d191663279
來源:简书