目录
1 简介
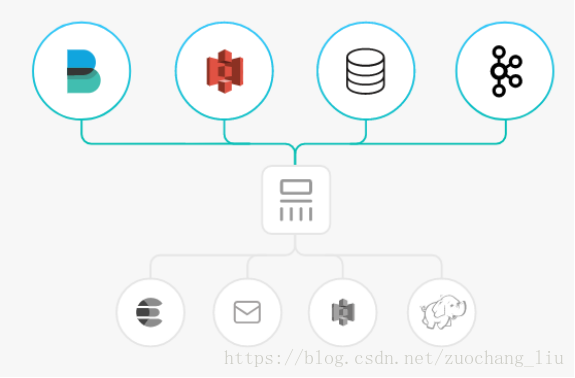
Logstash是一个开源的服务器端数据处理管道,它可以同时从多个源中提取数据,对其进行转换,然后将其发送到您最喜欢的“存储”。
开发语言: JRuby

1.1 Inputs
摄取所有形状,大小和来源的数据
数据通常以多种格式分散或分散在许多系统中。Logstash支持各种输入,这些输入同时从众多公共源中提取事件。通过连续的流媒体方式轻松从日志,指标,Web应用程序,数据存储和各种AWS服务中提取数据。
1.1.1 Input plugins
https://www.elastic.co/guide/en/logstash/current/input-plugins.html
An input plugin enables a specific source of events to be read by Logstash.
The following input plugins are available below. For a list of Elastic supported plugins, please consult the Support Matrix.
| Plugin |
Description |
Github repository |
| Receives events from the Elastic Beats framework |
||
| Pulls events from the Amazon Web Services CloudWatch API |
||
| Streams events from CouchDB’s _changes URI |
||
| read events from Logstash’s dead letter queue |
||
| Reads query results from an Elasticsearch cluster |
||
| Captures the output of a shell command as an event |
||
| Streams events from files |
||
| Reads Ganglia packets over UDP |
||
| Reads GELF-format messages from Graylog2 as events |
||
| Generates random log events for test purposes |
||
| Reads events from a GitHub webhook |
||
| Consume events from a Google Cloud PubSub service |
||
| Reads metrics from the graphite tool |
||
| Generates heartbeat events for testing |
||
| Receives events over HTTP or HTTPS |
||
| Decodes the output of an HTTP API into events |
||
| Reads mail from an IMAP server |
||
| Reads events from an IRC server |
||
| Creates events from JDBC data |
||
| Reads events from a Jms Broker |
||
| Retrieves metrics from remote Java applications over JMX |
||
| Reads events from a Kafka topic |
||
| Receives events through an AWS Kinesis stream |
||
| Reads events over a TCP socket from a Log4j SocketAppender object |
||
| Receives events using the Lumberjack protocl |
||
| Captures the output of command line tools as an event |
||
| Streams events from a long-running command pipe |
||
| Receives facts from a Puppet server |
||
| Pulls events from a RabbitMQ exchange |
||
| Reads events from a Redis instance |
||
| Receives RELP events over a TCP socket |
||
| Captures the output of command line tools as an event |
||
| Streams events from files in a S3 bucket |
||
| Creates events based on a Salesforce SOQL query |
||
| Creates events based on SNMP trap messages |
||
| Creates events based on rows in an SQLite database |
||
| Pulls events from an Amazon Web Services Simple Queue Service queue |
||
| Reads events from standard input |
||
| Creates events received with the STOMP protocol |
||
| Reads syslog messages as events |
||
| Reads events from a TCP socket |
||
| Reads events from the Twitter Streaming API |
||
| Reads events over UDP |
||
| Reads events over a UNIX socket |
||
| Reads from the varnish cache shared memory log |
||
| Reads events from a websocket |
||
| Creates events based on the results of a WMI query |
||
| Receives events over the XMPP/Jabber protocol |
1.2 Filters
https://www.elastic.co/guide/en/logstash/current/filter-plugins.html
即时解析和转换您的数据
当数据从源传输到存储时,Logstash过滤器会解析每个事件,识别命名字段以构建结构,并将它们转换为汇聚在通用格式上,以便更轻松,更快速地进行分析和业务价值。
无论格式或复杂性如何,Logstash都会动态转换和准备您的数据:
- 使用grok从非结构化数据中导出结构
- 从IP地址解密地理坐标
- 匿名化PII数据,完全排除敏感字段
- 简化整体处理,独立于数据源,格式或模式。
丰富的过滤器库可以实现无限可能。

1.3 Output
选择您的存储,传输您的数据
虽然Elasticsearch是我们的首选产品,它开辟了搜索和分析可能性的世界,但它并不是唯一可用的产品。
Logstash具有多种输出,可让您将数据路由到所需位置,从而可以灵活地解锁大量下游用例。

1.3.1 Output plugins
https://www.elastic.co/guide/en/logstash/current/output-plugins.html
An output plugin sends event data to a particular destination. Outputs are the final stage in the event pipeline.
The following output plugins are available below. For a list of Elastic supported plugins, please consult the Support Matrix.
| Plugin |
Description |
Github repository |
| Sends annotations to Boundary based on Logstash events |
||
| Sends annotations to Circonus based on Logstash events |
||
| Aggregates and sends metric data to AWS CloudWatch |
||
| Writes events to disk in a delimited format |
||
| Sends events to DataDogHQ based on Logstash events |
||
| Sends metrics to DataDogHQ based on Logstash events |
||
| Stores logs in Elasticsearch |
||
| Sends email to a specified address when output is received |
||
| Runs a command for a matching event |
||
| Writes events to files on disk |
||
| Writes metrics to Ganglia’s gmond |
||
| Generates GELF formatted output for Graylog2 |
||
| Writes events to Google BigQuery |
||
| Writes metrics to Graphite |
||
| Sends metric data on Windows |
||
| Sends events to a generic HTTP or HTTPS endpoint |
||
| Writes metrics to InfluxDB |
||
| Writes events to IRC |
||
| Pushes messages to the Juggernaut websockets server |
||
| Writes events to a Kafka topic |
||
| Sends metrics, annotations, and alerts to Librato based on Logstash events |
||
| Ships logs to Loggly |
||
| Sends events using the lumberjack protocol |
||
| Writes metrics to MetricCatcher |
||
| Writes events to MongoDB |
||
| Sends passive check results to Nagios |
||
| Sends passive check results to Nagios using the NSCA protocol |
||
| Writes metrics to OpenTSDB |
||
| Sends notifications based on preconfigured services and escalation policies |
||
| Pipes events to another program’s standard input |
||
| Pushes events to a RabbitMQ exchange |
||
| Sends events to a Redis queue using the RPUSHcommand |
||
| Creates tickets using the Redmine API |
||
| Writes events to the Riak distributed key/value store |
||
| Sends metrics to Riemann |
||
| Sends Logstash events to the Amazon Simple Storage Service |
||
| Sends events to Amazon’s Simple Notification Service |
||
| Stores and indexes logs in Solr |
||
| Pushes events to an Amazon Web Services Simple Queue Service queue |
||
| Sends metrics using the statsd network daemon |
||
| Prints events to the standard output |
||
| Writes events using the STOMP protocol |
||
| Sends events to a syslog server |
||
| Writes events over a TCP socket |
||
| Sends events to the Timber.io logging service |
||
| Sends events over UDP |
||
| Sends Logstash events to HDFS using the webhdfs REST API |
||
| Publishes messages to a websocket |
||
| Posts events over XMPP |
||
| Sends events to a Zabbix server |
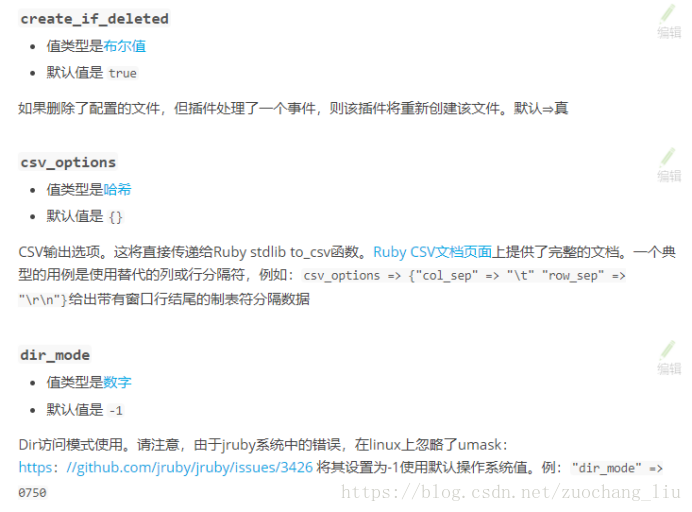
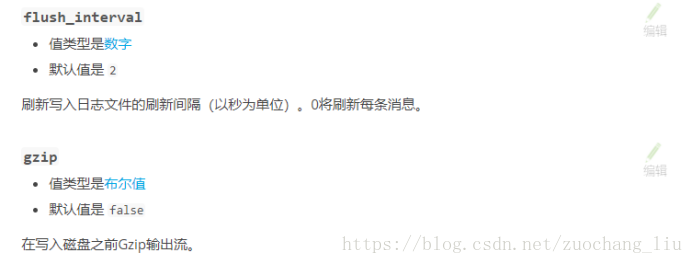
1.3.2 Csv输出插件示例
Csv输出配置选项
| Setting |
Input type |
Required |
| No |
||
| No |
||
| No |
||
| Yes |
||
| No |
||
| No |
||
| No |
||
| No |
||
| Yes |
||
| No |


output {

 file {

   path => ...

   codec => line { format => "custom format: %{message}"}

 }

}

The path to the file to write. Event fields can be used here,

like `/var/log/logstash/%{host}/%{application}`

One may also utilize the path option for date-based log

rotation via the joda time format. This will use the event

timestamp.

E.g.: `path => "./test-%{+YYYY-MM-dd}.txt"` to create

`./test-2013-05-29.txt`如果使用绝对路径,则无法以动态字符串开头。例如:/%{myfield}/,/test-%{myfield}/不是有效路径

Common Options
The following configuration options are supported by all output plugins:
| Setting |
Input type |
Required |
| No |
||
| No |
||
| No |

output {

  csv {

    id => "my_plugin_id"

  }

}
1.4 Logstash特点
1.4.1 即插即用
使用弹性堆栈加快洞察时间
Logstash模块使用ArcSight和NetFlow等流行数据源编排交钥匙摄取到可视化体验。凭借即时部署摄取管道和复杂仪表板的能力,您的数据探索将在几分钟内完成。
1.4.2 可扩展性
以您的方式创建和配置您的管道
Logstash有一个可插拔的框架,包含200多个插件。混合,匹配和编排不同的输入,过滤器和输出,以便在管道协调中工作。
从自定义应用程序中摄取?看不到你需要的插件?Logstash插件易于构建。我们有一个出色的插件开发API和一个插件生成器,可以帮助您开始和分享您的创作。
1.4.3 耐用性和安全性
相信可以交付的管道
如果Logstash节点碰巧失败,Logstash会保证至少一次传递具有其持久队列的正在进行的事件。未成功处理的事件可以分流到死信队列以进行内省和重放。凭借吸收吞吐量的能力,Logstash可以通过摄取峰值进行扩展,而无需使用外部排队层。
无论您是运行10个还是1000个Logstash实例,我们都可以让您完全保护您的摄取管道。来自Beats的传入数据以及其他输入可以通过线路加密,并且与安全的Elasticsearch集群完全集成。
1.4.4 检测
对部署具有完全可见性
Logstash管道通常具有多种功能,并且可以变得复杂,因此对管道性能,可用性和瓶颈的深刻理解是非常宝贵的。借助监视和管道查看器功能,您可以轻松观察和研究活动的Logstash节点或完整部署。
1.4.5 管理与检查
使用单个UI集中管理部署
使用管道管理UI掌控您的Logstash部署,这使得管理和管理管道变得轻而易举。管理控件还可与内置安全功能无缝集成,以防止任何意外重新布线。
2 安装
2.1 下载上传
https://www.elastic.co/guide/en/logstash/current/index.html
首先下载logstash,上传到服务器
logstash是用JRuby语言开发的,所以要安装JDK
2.2 解压
tar -zxvf logstash-2.3.1.tar.gz -C /bigdata/
2.3 配置
2.3.1 直接启动
bin/logstash -e 'input { stdin {} } output { stdout{} }'
bin/logstash -e 'input { stdin {} } output { stdout{codec => rubydebug} }'
bin/logstash -e 'input { stdin {} } output { elasticsearch {hosts => ["172.16.0.14:9200"]} stdout{} }'
bin/logstash -e 'input { stdin {} } output { elasticsearch {hosts => ["172.16.0.15:9200", "172.16.0.16:9200"]} stdout{} }'
bin/logstash -e 'input { stdin {} } output { kafka { topic_id => "test" bootstrap_servers => "172.16.0.11:9092,172.16.0.12:9092,172.16.0.13:9092"} stdout{codec => rubydebug} }'
2.3.2 以配置文件的形式
vi logstash.conf
input {
	file {
		type => "gamelog"
		path => "/log/*/*.log"
		discover_interval => 10
		start_position => "beginning"
	}
}

output {
    elasticsearch {
		index => "gamelog-%{+YYYY.MM.dd}"
        hosts => ["172.16.0.14:9200", "172.16.0.15:9200", "172.16.0.16:9200"]
    }
}
2.4 启动
#启动logstack
bin/logstash -f logstash.conf
3 常用配置案例
3.1 flow-es.conf
input {

  file {

    type => "flow"

    path => "/var/nginx_logs/*.log"

    discover_interval => 5

    start_position => "beginning"

  }

}


output {

  if [type] == "flow" {

    elasticsearch {

      index => "flow-%{+YYYY.MM.dd}"

      hosts => ["172.16.0.14:9200", "172.16.0.15:9200", "172.16.0.16:9200"]

    }

  }

}
3.2 flow-kafka.conf
input {
  file {
    path => "/export/data/logs/*.log"
    discover_interval => 5
    start_position => "beginning"
  }
}

output {
	kafka {
	  topic_id => "accesslog"
	  codec => plain {
		format => "%{message}"
		charset => "UTF-8"
	  }
	bootstrap_servers => "192.168.175.128:9092,192.168.175.133:9092,192.168.175.130:9092"
	}
}
3.3 kafka-es.conf
input {
  kafka {
    type => "level-one"
    auto_offset_reset => "smallest"
    codec => plain {
      charset => "GB2312"
    }
	group_id => "es"
	topic_id => "test"
	zk_connect => "172.16.0.11:2181,172.16.0.12:2181,172.16.0.13:2181"
  }
}

filter {
  mutate {
    split => { "message" => "	" }
      add_field => {
        "event_type" => "%{message[3]}"
        "current_map" => "%{message[4]}"
        "current_X" => "%{message[5]}"
        "current_y" => "%{message[6]}"
        "user" => "%{message[7]}"
        "item" => "%{message[8]}"
        "item_id" => "%{message[9]}"
        "current_time" => "%{message[12]}"
     }
     remove_field => [ "message" ]
  }
}
output {
    elasticsearch {
      index => "level-one-%{+YYYY.MM.dd}"
	  codec => plain {
        charset => "GB2312"
      }
      hosts => ["172.16.0.14:9200", "172.16.0.15:9200", "172.16.0.16:9200"]
    }
}
3.4 logstash.conf
input {
  file {
    type => "syslog"
    path => "/var/log/messages"
    discover_interval => 10
    start_position => "beginning"
  }

  file {
    type => "gamelog"
    path => "/log/*/*.log"
    discover_interval => 10
    start_position => "beginning"
  }
}

output {
  if [type] == "syslog" {
    elasticsearch {
      index => "syslog-%{+YYYY.MM.dd}"
      hosts => ["172.16.0.14:9200", "172.16.0.15:9200", "172.16.0.16:9200"]
    }
  }

  if [type] == "gamelog" {
    elasticsearch {
      index => "gamelog-%{+YYYY.MM.dd}"
      hosts => ["172.16.0.14:9200", "172.16.0.15:9200", "172.16.0.16:9200"]
    }
  }
}