摘要:Wright’s F‑statistics, and especially FST, provide important insights into the evolutionary processes that influence the structure of genetic variation within and among populations, and they are among the most widely used descriptive statistics in population and evolutionary genetics. Estimates of FST can identify regions of the genome that have been the target of selection, and comparisons of FST from different parts of the genome can provide insights into the demographic history of populations. For these reasons and others, FST has a central role in population and evolutionary genetics and has wide applications in fields that range from disease association mapping to forensic science. This Review clarifies how FST is defined, how it should be estimated, how it is related to similar statistics and how estimates of FST should be interpreted
2、例子
几乎每一种植物或动物物种都包括许多通常孤立的种群,由于遗传漂变或不同的自然选择,随着时间的推移,这些种群会发生基因分化.例如,最近基于370多个微卫星和60万个SNP的分析表明,来自主要地理区域的人口之间的遗传差异只占人类遗传多样性的5-10%。这些结果表明,地理上不同的人群之间的相似性远远大于差异性。但是,说5-10%的多样性是由人群之间的差异造成的,这意味着什么?这个数字是如何得出的?简而言之,从这些地区抽样的人群中,对微卫星数据的FST估计为0.05,对SNP估计为0.10.
3、历史
在20世纪40年代和50年代,SewallWright和GustaveMalecot分别独立引进F统计作为区分种群内和种群间遗传多样性划分的工具。在1931年发表的一篇论文中,Wright已经全面描述了导致种群间遗传分化的过程。群体间遗传分化量与重要进化过程(迁移、突变和漂移)的速率有可预测的关系。例如,迁移较多的大种群间差异较小,而迁移较少的小种群间差异较大,FST是这种分化的一种便利度量,因此FST和相关统计数据是群体和进化遗传学中使用最广泛的描述性统计数据之一。但是FST不仅仅是一个描述性的统计数据,更是一种遗传分化的测量。FST与群体间等位基因频率的差异直接相关,与群体内个体间的相似性程度成反比。如果FST小,说明每一个群体内的等位基因频率相似;如果值大,说明等位基因频率不同。如果在某些种群中,自然选择倾向于一个等位基因而不是另一个等位基因,那么在该位点上的FST将大于在纯粹由遗传漂变导致的群体间差异的位点上的FST。因此,将FST的单位点估计值与全基因组背景进行比较的基因组扫描,可能会识别出基因组中受到多样化影响的区域【6-8】.或者,如果群体统计学历史以不同于常染色体的遗传变异的方式影响性染色体的遗传变异,来自性染色体maker的FST的估计可能会不同与来自常染色体maker的FST的标记。进化增加了种群间的差异,也增加了种群内个体间的相似性。因此,在病例和对照之间对等位基因频率进行比对时,必须考虑FST,以确保它们之间的差异大于随机期望。
4、定义
这些参数是:FIT,个体内配子相对于整个群体的相关性;FIS,个体内配子与该个体所属亚种群的相关性;FST是指从同一亚群中随机选择的配子相对于整个亚群的相关性。
As an example of how to calculate genetic diversity, consider two populations that are segregating for two alleles at a single locus。假设第一个群体中A1等位基因的频率标记为p1,第二个群体中A1等位基因的频率为p2。A1A1基因型在第一个群体中的频率标记为x11,1;A1A2基因型被标记为x12,1;以此类推。两个群体的基因型频率由以下一组方程给出:
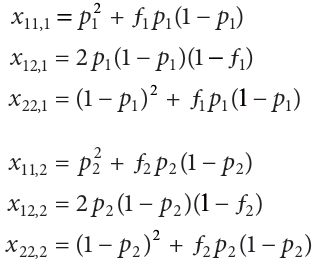
ƒ1和ƒ2通常被称为群体内近亲繁殖系数(inbreeding coefficients)。在实践中,ƒ是衡量杂合子的频率与特定基因型在哈迪温伯格定律中的预期比例(In practice, ƒ is a measure of the frequency of heterozygotes compared with that expected when genotypes are in Hardy–Weinberg proportions)。