mianwindow.h
#ifndef MAINWINDOW_H
#define MAINWINDOW_H


#include <QMainWindow>
#include <QChart>
//using namespace QtCharts;
QT_CHARTS_USE_NAMESPACE
#include <QLineSeries>
#include <QValueAxis>
#include <QTime>
#include <QChart>
#include <QtMath>
#include <QFontDialog>
#include <QColorDialog>
#include "qwdialogpen.h"


namespace Ui {
class MainWindow;
}


class MainWindow : public QMainWindow
{
Q_OBJECT
private:
    QLineSeries *curSeries;//当前序列
    QValueAxis *curAxis;//当前坐标轴
    void createChart();//创建图表
    void prepareData();//更新数据
    void updateFromChart();//从图表更新的界面
public:
explicit MainWindow(QWidget *parent = nullptr);
~MainWindow();


private slots:
    void on_actDraw_triggered();


    void on_btnSetTitle_clicked();


    void on_btnSetTitleFont_clicked();


    void on_btnSetMargin_clicked();


    void on_chkPointVisible_clicked(bool checked);


    void on_chkPointLabelVisible_clicked(bool checked);


    void on_btnSeriesName_clicked();


    void on_btnSeriesColor_clicked();


    void on_chkLegendVisible_clicked(bool checked);


    void on_btnSetAxisRange_clicked();


    void on_spinTickCount_valueChanged(int arg1);


    void on_spinMinorTickCount_valueChanged(int arg1);


    void on_radioX_clicked();


    void on_radioY_clicked();


    void on_chkBoxVisible_clicked(bool checked);


    void on_chkGridLineVisible_clicked(bool checked);


    void on_chkMinorTickVisible_clicked(bool checked);


    void on_radioButton_clicked();


    void on_radioButton_2_clicked();


    void on_radioButton_3_clicked();


    void on_radioButton_4_clicked();


    void on_btnLegendFont_clicked();


    void on_btnLegendlabelColor_clicked();


    void on_btnAxisSetTitle_clicked();


    void on_btnAxisSetTitleFont_clicked();


    void on_chkBoxAxisTitle_clicked(bool checked);


    void on_pushButton_clicked();


    void on_btnAxisLabelColor_clicked();


    void on_btnAxisLabelFont_clicked();


    void on_btnGridLineColor_clicked();


    void on_pushButton_10_clicked();


    void on_chkAxisLineVisible_clicked(bool checked);


    void on_btnAxisLinePen_clicked();


    void on_btnAxisLinePenColor_clicked();


    void on_btnMinorColor_clicked();


    void on_btnMinorPen_clicked();


    void on_radioSeries0_clicked(bool checked);


    void on_radioSeries1_clicked();


    void on_radioSeries0_clicked();


    void on_chkSeriesVisible_clicked(bool checked);


    void on_btnSeriesPen_clicked();


    void on_sliderSeriesOpacity_valueChanged(int value);


    void on_btnSeriesLabColor_clicked();


    void on_btnSeriesLabFont_clicked();


    void on_radioSeriesLabFormat0_clicked();


    void on_radioSeriesLabFormat1_clicked();


    void on_cBoxAnimation_currentIndexChanged(int index);


    void on_cBoxTheme_currentIndexChanged(int index);


    void on_actZoomIn_triggered();


    void on_actZoomOut_triggered();


    void on_actZoomReset_triggered();


private:
Ui::MainWindow *ui;
};


#endif // MAINWINDOW_H
qwdialogpen.h
#ifndef QWDIALOGPEN_H
#define QWDIALOGPEN_H


#include <QDialog>
#include <QPen>
#include <QColor>


namespace Ui {
class QWDialogPen;
}


class QWDialogPen : public QDialog
{
Q_OBJECT


QPen m_pen;
public:
    void setPen(QPen pen);//设置QPen,用于对话框的显示
    QPen getPen();//获取对话框设置的QPen属性
    static QPen getPen(QPen inipen,bool &ok);//静态函数
public:
explicit QWDialogPen(QWidget *parent = nullptr);
~QWDialogPen();


private:
Ui::QWDialogPen *ui;
};


#endif // QWDIALOGPEN_H
mainwindow.cpp
#include "mainwindow.h"
#include "ui_mainwindow.h"


MainWindow::MainWindow(QWidget *parent) :
QMainWindow(parent),
ui(new Ui::MainWindow)
{
ui->setupUi(this);
createChart();
prepareData();
updateFromChart();
}


MainWindow::~MainWindow()
{
delete ui;
}
void MainWindow::createChart()//创建图表
{
    QChart *chart=new QChart();
    chart->setTitle("图表名称");
    ui->chartView->setChart(chart);
    ui->chartView->setRenderHint(QPainter::Antialiasing);
    //新建序列
    QLineSeries *series0=new QLineSeries();
    QLineSeries *series1=new QLineSeries();
    series0->setName("sin曲线");
    series1->setName("cos曲线");
    curSeries=series0;
    //设置序列0画笔
    QPen pen;
    pen.setWidth(2);
    pen.setStyle(Qt::SolidLine);
    pen.setColor(Qt::blue);
    series0->setPen(pen);
    //设置序列1画笔
    pen.setStyle(Qt::DashLine);
    pen.setColor(Qt::red);
    pen.setWidth(1);
    series1->setPen(pen);
    //添加序列
    chart->addSeries(series0);
    chart->addSeries(series1);
    //创建X坐标轴
    QValueAxis *axisX=new QValueAxis;
    curAxis=axisX;
    axisX->setRange(0,10);//范围
    axisX->setLabelFormat("%.1f");//标签格式
    axisX->setTickCount(11);//主分隔个数
    axisX->setMinorTickCount(4);//小分隔个数
    axisX->setTitleText("time(secs)");//标题
    //创建Y坐标轴
    QValueAxis *axisY=new QValueAxis;
    axisY->setRange(-2,2);
    axisY->setLabelFormat("%.2f");
    axisY->setTickCount(5);
    axisY->setMinorTickCount(4);
    axisY->setTitleText("Value");
    //设置坐标轴
    chart->setAxisX(axisX,series0);
    chart->setAxisY(axisY,series0);
    chart->setAxisX(axisX,series1);
    chart->setAxisY(axisY,series1);
}
void MainWindow::prepareData()//为序列生成数据
{
    QLineSeries *series0=(QLineSeries*)ui->chartView->chart()->series().at(0);//获取序列0
    QLineSeries *series1=(QLineSeries*)ui->chartView->chart()->series().at(1);//获取序列1
    //清除数据
    series0->clear();
    series1->clear();
    qsrand(QTime::currentTime().second());//
    qreal t=0,y1,y2,intv=0.1;
    qreal rd;
    int cnt=100;
    for(int i=0;i<cnt;i++)
    {
        rd=(qrand()%10)-5;//随机范围-5-5
        y1=qSin(t)+rd/50;
        series0->append(t,y1);//序列添加数据点
        y2=qCos(t)+rd/50;
        series1->append(t,y2);
        t+=intv;
    }
}
void MainWindow::updateFromChart()//从列表获取数据更新界面显示
{
    QChart *aChart=ui->chartView->chart();//获取chart
    ui->editTitle->setText(aChart->title());//设置图表标题
    QMargins mg=aChart->margins();//获取边距
    ui->spinMarginTop->setValue(mg.top());
    ui->spinMarginLeft->setValue(mg.left());
    ui->spinMarginRight->setValue(mg.right());
    ui->spinMarginBottom->setValue(mg.bottom());
}


void MainWindow::on_actDraw_triggered()//刷新
{
    prepareData();
}


void MainWindow::on_btnSetTitle_clicked()//设置标题
{
    QString str=ui->editTitle->text();
    ui->chartView->chart()->setTitle(str);
}


void MainWindow::on_btnSetTitleFont_clicked()//设置字体
{
    QFont font=ui->chartView->chart()->titleFont();
    bool ok=false;
    font=QFontDialog::getFont(&ok,font);
    if(ok)
    {
        ui->chartView->chart()->setTitleFont(font);
    }
}


void MainWindow::on_btnSetMargin_clicked()//设置边距
{
    QMargins mg;
    mg.setTop(ui->spinMarginTop->value());
    mg.setLeft(ui->spinMarginLeft->value());
    mg.setRight(ui->spinMarginRight->value());
    mg.setBottom(ui->spinMarginBottom->value());
    ui->chartView->chart()->setMargins(mg);
}


void MainWindow::on_chkPointVisible_clicked(bool checked)//数据点可见性
{
    curSeries->setPointsVisible(checked);
}


void MainWindow::on_chkPointLabelVisible_clicked(bool checked)//数据点标签可见
{
    curSeries->setPointLabelsVisible(checked);
}


void MainWindow::on_btnSeriesName_clicked()//设置序列名称
{
    QString str=ui->editSeriesName->text();
    curSeries->setName(str);
}


void MainWindow::on_btnSeriesColor_clicked()//序列曲线的颜色
{
    QColor color=curSeries->color();
    color=QColorDialog::getColor(color);
    if(color.isValid())
    {
        curSeries->setColor(color);
    }
}


void MainWindow::on_chkLegendVisible_clicked(bool checked)//图例是否可见
{
    ui->chartView->chart()->legend()->setVisible(checked);
}


void MainWindow::on_btnSetAxisRange_clicked()//设置坐标轴范围
{
    curAxis->setRange(ui->spinAxisMin->value(),ui->spinAxisMax->value());
}


void MainWindow::on_spinTickCount_valueChanged(int arg1)//主分隔个数改变
{
    curAxis->setTickCount(arg1);
}


void MainWindow::on_spinMinorTickCount_valueChanged(int arg1)//小分隔个数
{
    curAxis->setMinorTickCount(arg1);
}


void MainWindow::on_radioX_clicked()//获取当前坐标轴
{
    if (ui->radioX->isChecked())
        curAxis=(QValueAxis*)ui->chartView->chart()->axisX();
    else
        curAxis=(QValueAxis*)ui->chartView->chart()->axisY();


    //获取坐标轴的各种属性,显示到界面上
    ui->spinAxisMin->setValue(curAxis->min());
    ui->spinAxisMax->setValue(curAxis->max());


    ui->editAxisTitle->setText(curAxis->titleText());
    ui->chkBoxAxisTitle->setChecked(curAxis->isTitleVisible());


    ui->editAxisLabelFormat->setText(curAxis->labelFormat());
    ui->chkBoxLabelsVisible->setChecked(curAxis->labelsVisible());


    ui->chkGridLineVisible->setChecked(curAxis->isGridLineVisible());
    ui->chkAxisLineVisible->setChecked(curAxis->isLineVisible());


    ui->spinTickCount->setValue(curAxis->tickCount());
    ui->chkAxisLineVisible->setChecked(curAxis->isLineVisible());


    ui->spinMinorTickCount->setValue(curAxis->minorTickCount());
    ui->chkMinorTickVisible->setChecked(curAxis->isMinorGridLineVisible());
}


void MainWindow::on_radioY_clicked()//同x坐标轴
{
    on_radioX_clicked();
}


void MainWindow::on_chkBoxVisible_clicked(bool checked)//坐标轴是否可见
{
    curAxis->setVisible(checked);
}


void MainWindow::on_chkGridLineVisible_clicked(bool checked)//轴的网格线是否可见
{
    curAxis->setGridLineVisible(checked);
}


void MainWindow::on_chkMinorTickVisible_clicked(bool checked)//次级刻度是否可见
{
    curAxis->setMinorGridLineVisible(checked);
}


void MainWindow::on_radioButton_clicked()//图例的位置上
{
    ui->chartView->chart()->legend()->setAlignment(Qt::AlignTop);
}


void MainWindow::on_radioButton_2_clicked()//图例的位置下
{
    ui->chartView->chart()->legend()->setAlignment(Qt::AlignBottom);
}


void MainWindow::on_radioButton_3_clicked()//图例的位置左
{
    ui->chartView->chart()->legend()->setAlignment(Qt::AlignLeft);
}


void MainWindow::on_radioButton_4_clicked()//图例的位置右
{
    ui->chartView->chart()->legend()->setAlignment(Qt::AlignRight);
}


void MainWindow::on_btnLegendFont_clicked()//图例字体
{
    QFont font=ui->chartView->chart()->legend()->font();
    bool ok=false;
    font=QFontDialog::getFont(&ok,font);
    if(ok)
    {
        ui->chartView->chart()->legend()->setFont(font);
    }
}


void MainWindow::on_btnLegendlabelColor_clicked()//图例颜色
{
    QColor color=ui->chartView->chart()->legend()->color();
    color=QColorDialog::getColor(color);
    if(color.isValid())
    {
        ui->chartView->chart()->legend()->setColor(color);
    }
}


void MainWindow::on_btnAxisSetTitle_clicked()//坐标轴标题
{
    QString str=ui->editAxisTitle->text();
    curAxis->setTitleText(str);
}


void MainWindow::on_btnAxisSetTitleFont_clicked()//坐标轴字体
{
    QFont font=curAxis->titleFont();
    bool ok=false;
    font=QFontDialog::getFont(&ok,font);
    if(ok)
    {
        curAxis->setTitleFont(font);
    }
}


void MainWindow::on_chkBoxAxisTitle_clicked(bool checked)//轴标题是否可见
{
    curAxis->setTitleVisible(checked);
}


void MainWindow::on_pushButton_clicked()//设置坐标轴刻度标签的文字格式
{
    curAxis->setLabelFormat(ui->editAxisLabelFormat->text());
}


void MainWindow::on_btnAxisLabelColor_clicked()//标签文字颜色
{
    QColor   color=curAxis->labelsColor();
    color=QColorDialog::getColor(color);
    if (color.isValid())
        curAxis->setLabelsColor(color);
}


void MainWindow::on_btnAxisLabelFont_clicked()//标签文字字体
{
    QFont font=curAxis->labelsFont();
    bool ok=false;
    font=QFontDialog::getFont(&ok,font);
    if(ok)
    {
        curAxis->setLabelsFont(font);
    }
}


void MainWindow::on_btnGridLineColor_clicked()//网格线颜色
{
    QColor   color=curAxis->gridLineColor();
    color=QColorDialog::getColor(color);
    if (color.isValid())
        curAxis->setGridLineColor(color);
}


void MainWindow::on_pushButton_10_clicked()//网格线pen
{
    QPen    pen;
    pen=curAxis->gridLinePen();
    bool    ok=false;
    pen=QWDialogPen::getPen(pen,ok);
    if (ok)
        curAxis->setGridLinePen(pen);
}


void MainWindow::on_chkAxisLineVisible_clicked(bool checked)//刻度是否可见
{
    curAxis->setLineVisible(checked);
}


void MainWindow::on_btnAxisLinePen_clicked()//linepen
{
    QPen    pen;
    pen=curAxis->linePen();
    bool    ok=false;
    pen=QWDialogPen::getPen(pen,ok);
    if (ok)
        curAxis->setLinePen(pen);
}


void MainWindow::on_btnAxisLinePenColor_clicked()//LinePenColor
{
    QColor   color=curAxis->linePenColor();
    color=QColorDialog::getColor(color);
    if (color.isValid())
        curAxis->setLinePenColor(color);
}


void MainWindow::on_btnMinorColor_clicked()//次级网格颜色
{
    QColor color=curAxis->minorGridLineColor();
    color=QColorDialog::getColor(color);
    if (color.isValid())
        curAxis->setMinorGridLineColor(color);
}


void MainWindow::on_btnMinorPen_clicked()//次级网格线pen
{
    QPen    pen;
    pen=curAxis->minorGridLinePen();
    bool    ok=false;
    pen=QWDialogPen::getPen(pen,ok);
    if (ok)
        curAxis->setMinorGridLinePen(pen);
}


void MainWindow::on_radioSeries0_clicked(bool checked)//获取当前数据序列
{
}


void MainWindow::on_radioSeries1_clicked()
{
    on_radioSeries0_clicked();
}


void MainWindow::on_radioSeries0_clicked()
{
    if (ui->radioSeries0->isChecked())
        curSeries=(QLineSeries *)ui->chartView->chart()->series().at(0);
    else
        curSeries=(QLineSeries *)ui->chartView->chart()->series().at(1);
    //获取序列的属性值,并显示到界面上
    ui->editSeriesName->setText(curSeries->name());
    ui->chkSeriesVisible->setChecked(curSeries->isVisible());
    ui->chkPointVisible->setChecked(curSeries->pointsVisible());
    ui->sliderSeriesOpacity->setValue(curSeries->opacity()*10);
    ui->chkPointLabelVisible->setChecked(curSeries->pointLabelsVisible());
}


void MainWindow::on_chkSeriesVisible_clicked(bool checked)//序列可见
{
    this->curSeries->setVisible(checked);
}


void MainWindow::on_btnSeriesPen_clicked()//序列Pen
{
    QPen    pen;
    pen=curSeries->pen();
    bool ok=false;
    pen=QWDialogPen::getPen(pen,ok);
    if (ok)
        curSeries->setPen(pen);
}


void MainWindow::on_sliderSeriesOpacity_valueChanged(int value)//透明度
{
     curSeries->setOpacity(value/10.0);
}


void MainWindow::on_btnSeriesLabColor_clicked()//序列点标签颜色
{
    QColor  color=curSeries->pointLabelsColor();
    color=QColorDialog::getColor(color);
    if (color.isValid())
        curSeries->setPointLabelsColor(color);


}


void MainWindow::on_btnSeriesLabFont_clicked()//序列点标签字体
{
    QFont   font;
    font=curSeries->pointLabelsFont();
    bool    ok=false;
    font=QFontDialog::getFont(&ok,font);
    if (ok)
        curSeries->setPointLabelsFont(font);
}


void MainWindow::on_radioSeriesLabFormat0_clicked()//格式
{
    curSeries->setPointLabelsFormat("@yPoint");
}


void MainWindow::on_radioSeriesLabFormat1_clicked()//格式
{
    curSeries->setPointLabelsFormat("@xPoint,@yPoint");
}


void MainWindow::on_cBoxAnimation_currentIndexChanged(int index)//动画
{
     ui->chartView->chart()->setAnimationOptions(QChart::AnimationOptions(index));
}


void MainWindow::on_cBoxTheme_currentIndexChanged(int index)//主题
{
    ui->chartView->chart()->setTheme(QChart::ChartTheme(index));
}


void MainWindow::on_actZoomIn_triggered()//放大
{
     ui->chartView->chart()->zoom(1.2);
}


void MainWindow::on_actZoomOut_triggered()//缩小
{
     ui->chartView->chart()->zoom(0.8);
}


void MainWindow::on_actZoomReset_triggered()//复原
{
    ui->chartView->chart()->zoomReset();
}
qwdialogpen.cpp
#include "qwdialogpen.h"
#include "ui_qwdialogpen.h"


QWDialogPen::QWDialogPen(QWidget *parent) :
QDialog(parent),
ui(new Ui::QWDialogPen)
{
ui->setupUi(this);


ui->comboBox->clear();
ui->comboBox->addItem("SolidLine",1);
ui->comboBox->addItem("DashLine",2);
ui->comboBox->addItem("DotLine",3);
ui->comboBox->setCurrentIndex(1);
}


QWDialogPen::~QWDialogPen()
{
delete ui;
}
/*
 * Qt的标准对话框一般都有静态函数
 * 使用静态函数无需管理对话框的创建和删除
 */
/**
 * @brief QWDialogPen::getPen
 * @param inipen
 * @param ok
 * @return
 */
QPen QWDialogPen::getPen(QPen inipen,bool &ok)
{
    QWDialogPen *dlg=new QWDialogPen;
    dlg->setPen(inipen);//设置初始化QPen
    QPen pen;
    int ret=dlg->exec();//弹出对话框
    if(ret==QDialog::Accepted)
    {
        pen=dlg->getPen();
        ok=true;
    }
    else
    {
        pen=inipen;
        ok=false;
    }
    delete dlg;//删除对话框
    return pen;//返回QPen
}
/**
 * @brief QWDialogPen::setPen
 * @param pen
 */
void QWDialogPen::setPen(QPen pen)//设置QPen,并刷新显示界面
{
    m_pen=pen;
    ui->spinBox->setValue(pen.width());//设置线宽初始值为现在QPen的线宽
    int i=static_cast<int>(pen.style());//获取线形并转换为索引值
    ui->comboBox->setCurrentIndex(i);//comboBox赋值
    QColor color;
    color=pen.color();
    //设置按钮背景色
    ui->pushButton->setAutoFillBackground(true);
    QString str=QString::asprintf("background-color:rgb(%d,%d,%d);",color.red(),color.green(),color.blue());
    ui->pushButton->setStyleSheet(str);
}
/**
 * @brief QWDialogPen::getPen
 * @return
 */
QPen QWDialogPen::getPen()//获得设置的属性
{
    m_pen.setWidth(ui->spinBox->value());//线宽
    m_pen.setStyle(Qt::PenStyle(ui->comboBox->currentIndex()));//线形
    //颜色
    QColor color=ui->pushButton->palette().color(QPalette::Button);
    m_pen.setColor(color);

    return m_pen;
}
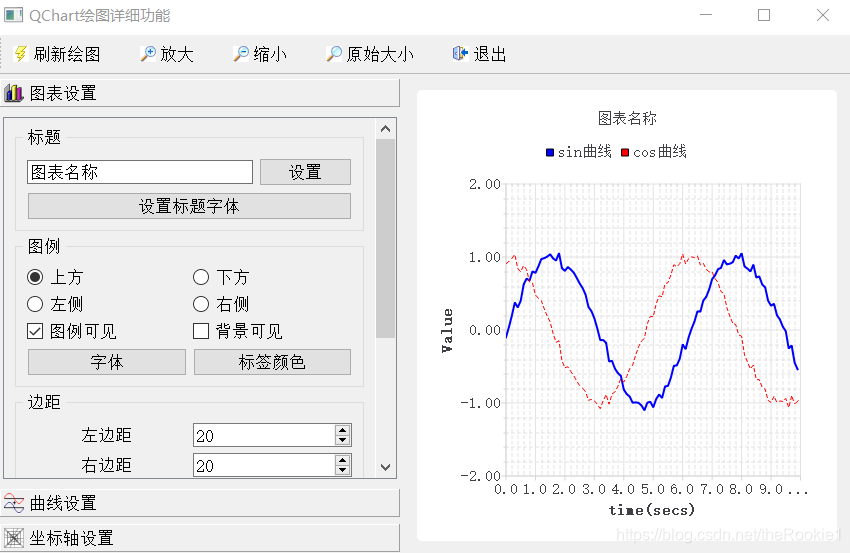
运行结果