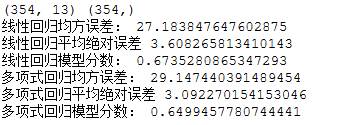
from sklearn.datasets import load_boston  #导入Boston房价数据集
boston = load_boston()   #读取数据集
# boston.keys()    #查看key值
x = boston.data
y = boston.target

#训练集与测试集划分
from sklearn.cross_validation import train_test_split
x_train,x_test,y_train,y_test = train_test_split(x,y,test_size=0.3,random_state=0)
#其中 test_size是样本占比,如果是整数的话就是样本的数量;
#random_state是随机数的种子,不同的种子会造成不同的随机采样结果,相同的种子采样结果相同。
print(x_train.shape,y_train.shape)

#建立一元线性回归模型
from sklearn.linear_model import LinearRegression
lr = LinearRegression()
lr.fit(x_train,y_train)
lr.coef_    #系数
lr.intercept_   #截距


#检测模型好坏
from sklearn.metrics import regression
y_pred = lr.predict(x_test)   #预测
n = regression.mean_squared_error(y_test,y_pred) #预测模型均方误差
print("线性回归均方误差:",n)
a = regression.mean_absolute_error(y_test,y_pred)
print("线性回归平均绝对误差",a)
s = lr.score(x_test,y_test)  #模型分数
print("线性回归模型分数:",s)


#多元多项式回归模型
from sklearn.preprocessing import PolynomialFeatures
poly= PolynomialFeatures(degree=2)
x_poly_train= poly.fit_transform(x_train) #多项式化
x_poly_test  = poly.transform(x_test)

#建立模型
lr2 = LinearRegression()
lr2.fit(x_poly_train,y_train)

#预测
y_pred2 = lr2.predict(x_poly_test)

#检测模型好坏,计算模型的预测指标
n2 = regression.mean_squared_error(y_test,y_pred2)
print("多项式回归均方误差:",n2)
a2 = regression.mean_absolute_error(y_test,y_pred2)
print("多项式回归平均绝对误差",a2)
s2 = lr2.score(x_poly_test,y_test)
print("多项式回归模型分数:",s2)
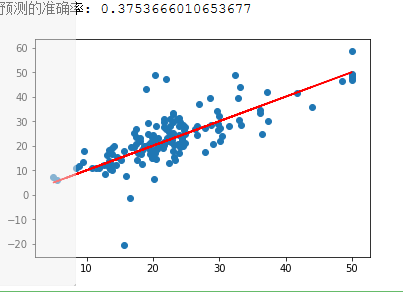
#多项式回归模型:建立13个变量与房价之间的预测模型,并检测模型好坏。
from sklearn.preprocessing import PolynomialFeatures
poly=PolynomialFeatures(degree=2)
from sklearn.linear_model import LinearRegression
lineR=LinearRegression()
x= boston.data
y = boston.target
x_train,x_test,y_train,y_test=train_test_split(x,y,test_size=0.3)#划分训练集和测试集
#多项式操作
x_train_poly=poly.fit_transform(x_train)
x_test_poly=poly.transform(x_test)
lineR.fit(x_train_poly,y_train)#建立模型
print('预测的准确率:',lineR.score(x_test_poly,y_test))

#图形化将元数据,一元拟合,多元拟合进行绘图观察
from sklearn.linear_model import LinearRegression
import matplotlib.pyplot as plt
lineR=LinearRegression()
lineR.fit(x_train_poly,y_train)
y_poly_pred=lineR.predict(x_test_poly)
plt.plot(y,y,'r')
plt.scatter(y_test,y_poly_pred)
plt.show()
#3. 多元线性回归模型,建立13个变量与房价之间的预测模型,并检测模型好坏,并图形化显示检查结果。
import matplotlib.pyplot as plt
x=boston.data[:,12].reshape(-1,1)
y=boston.target
plt.figure(figsize=(10,6))
plt.scatter(x,y)

from sklearn.linear_model import LinearRegression
lineR=LinearRegression()
lineR.fit(x,y)
y_pred = lineR.predict(x)
plt.plot(x,y_pred)
plt.show()

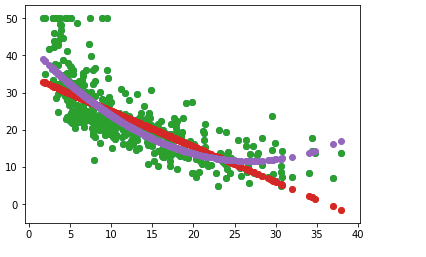
#4.  一元多项式回归模型,建立一个变量与房价之间的预测模型,并图形化显示。
from sklearn.preprocessing import PolynomialFeatures
poly = PolynomialFeatures (degree=2)
x_poly = poly.fit_transform(x)

lrp = LinearRegression()
lrp.fit(x_poly,y)
y_poly_pred=lrp.predict(x_poly)
plt.scatter(x,y)
plt.scatter(x,y_pred)
plt.scatter(x,y_poly_pred)
plt.show()