A Small Definition of Big Data
The term "big data" seems to be popping up everywhere these days. And there seems to be as many uses of this term as there are contexts in which you find it: 'big data' is often used to refer to any dataset that is difficult to manage using traditional database systems; it is also used as a catch-all term for any collection of data that is too large to process on a single server; yet others use the term to simply eman "a lot of data"; sometimes it turns out it doesn't even have to be large. So what exactly is big data?
A precise specification of 'big' is elusive. What is considered big for one organization may be small for another. What is large-scale today will likely seem small-scale in the near future. petabyte is the new terabyte. Thus, size alone cannot specify big data. The complexity of the data is an import factor that must also be considered.
Most now agree with the characterizating of big data using the 3 V's coined by Doug Laney of Gartner:
-
Volume: this refers to the vast amounts of data that is generated every second/min-ute/hour/day in our digitized world.
-
Velocity: This refers to the speed at which data is beging generated and the pace at which data moves from one point to the next.
-
Variety: This refers to the ever-increasing different forms that data can come in, e.g., text, images, voice, geospatial.
-
A fourth V is now also sometimes added:
-
Veracity: This refers to the quality of the data, which can vary greatly.
-
The above V's are the dimensions that characterize big data, and also embody its challenges; We have huge amounts of data, in different formats and varing quality, that must be processed quickly.
-
It is important to note that the goal of processing big data is to gain insight to support decision-making. It is not sufficient to just be able to capture and store the data. The point of collecting and processing volumes of complex data is to understand trends, uncover hidden patterns, detect anomalies, etc. So that you have a better understanding of the problem being analyzed and can make more informed, data-driven decisions. In fact, many consider value as the fifth V of big data:
-
Value: Processing big data must bring about value from insights gained.
To address the challenges of big data, innovative technologies are needed. Parallel, distributed computing paradigms, scalable machine learning algorithms, and real-time querying are key to analysis of big data. Distributed file systems, computing clusters, cloud computing, and data stores supporting data variety and agility are also necessary to provide the infrastructure for processing of big data. Workflows provide an intuitive, reusable, scalable and reproducible way to process big data to gain verifiable value from it in and enable application of same methods to different datasets.
With all the data generated from social media, smart sensors satellites, surveillance carmera, the Internet, and countless other devices, big data is all around us. The endeavor to make sense out of that data brings about exciting opportunities indeed!
Data Science
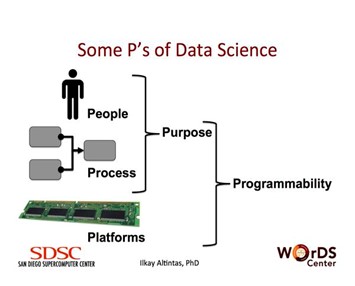
Data Science is about extracting knowledge from data. At the WorkDS Center, we define data science as a multidisciplinary craft that combines people, process, computational and Big Data platforms, application-specific purpose and programmability. Publications and provenance of the data products leading to these publications are also important for data science.
-
People: The data scientists are often seen as people who possess skills on a variety of topics including: science or business domain knowledge; analysis using statistics, machine learning and mathematical knowledge; data management, programming and computing. In practice, this is generally a group of researchers comprised of people with complementary skills.
-
Process: The process of data science includes techniques for statistics, machine learning, programming, computing and data management. Data science workflows combine such steps in executable graphs. we believe that process-origented thinking is a transformative way of conducting data science to connect people and techniques to applications. Challenges for the data science progress include 1) how to easily integrate all needed tasks to build such a progress; 2) how to find the best computing resources and efficiently schedule process executions to the resource based on process definition, parameter settings, and user preferences.
-
Purpose: Purpose comes when people use generalizable processes with a particular goal in mind. The purpose can be related to a scientific analysis with a hypothesis or a business metric that needs to be analyzed based often on Big Data. Note that similar reusable processes can be applicable to many applications with different purposes when employed within different workflows.
-
Platforms: Based on the needs of an application-driven purpose and the amount of data and computing required to perform this application, different computing and data platforms can be used as a part of the data science process. This scalability should be made part of any data science solution architecture.
-
Programmability: Capturing a scalable data science process requires aid from programming languages, e.g. R, and patterns, e.g., MapReduce. Tools that provide access to such programming techniques are key to making the data science process programmable on a variety of platforms.
Execution of such a data science process requires access to many datasets, Big and small, bringing new opportunities and challenges to Data Science. There are many Data Science steps or tasks, such as Data Collection, Data Cleaning, Data Processing/Analysis, Result Visualization, resulting in a Data Science Workflow. Data Science Processes may need user interaction and other manual operations, or be fully automated.
MapReduce
Map-Reduce is a scalable programming model that simplifies distributed processing of data. Map-Reduce consists of three main steps: Mapping, Shuffling and Reducing. An easy way to think about a Map-Reduce job is to compare it with act of 'delegating' a large task to a group of people, and combining the result of each person's effort, to produce the final outcome.
Let's take an example to bring the point across. You just heard about this great news at your office, and are throwing a party for all your colleagues! You decide to cook Pasta for the dinner. Four of your friends, who like cooking, also volunteer to join you in preparation. The task of preparing Pasta broadly involves chopping the vegetables, cooking, and garnishing.
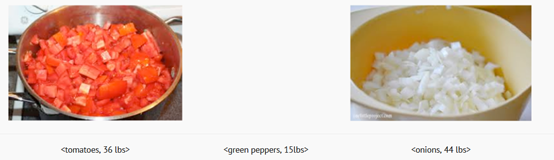
Let's take the job of chopping the vegetables and see how it is analogous to map-reduce task. Here the raw vegetables are symbolic of the input data, your friends are equivalent to compute nodes, and final chopped vagetables are analogous to desired outcome. Each friend is allotted onions, tomatoes and peppers to chop and weigh.
You would also like to know how much of each vegetable types you have in the kitchen. You would also like to chop these vegetables while this calculation is occurring. In the end, the onions should be in one large bowl with a label that displays its weight in pounds, tomatoes in aseparate one, and so on.

MAP: To start with, you assign each of your four friends a random mix of different types of vegetables. They are required to use their 'compute' powers to chop them and measure the weight of each type of veggie. They need to ensure not mix different types of veggies. So each friend will generate a mapping of <key,value> pairs that looks like:
Friend X:
<tomatoes, 5lbs>
<onions, 10lbs>
<garlic, 2lbs>
Friend Y:
<onions, 22lbs>
<green peppers, 5lbs>
……
Seems like you are having a really big party! Now that your friends have chopped the vegetables, and labeled each bowl with the weight and type of vegetable, we move to the next stage: Shuffling.
SHUFFLE: This stage is also called Grouping. Here you want to group the veggies by their types. You assign different parts of your kitchen to each type of veggie, and your friends are supposed to group the bowls, so that like items are placed together.

North End of Kitchen:
<tomatoes, 5lbs>
<tomatoes, 11lbs>

West End of Kitchen:
<onions, 10lbs>
<onions, 22lbs>
<onions, 1.4lbs>

East End of Kitchen:
<green peppers, 3lbs>
<green peppers, 10lbs>
The party start in a couple of hours, but you are impressed by what your friends have accomplished by Mapping and Grouping so far! The kitchen looks much more organized now and the raw material is chopped. The final stage of this task is to measure how much of each veggie you actually have. This brings us to the Reduce stage.
REDUCE: In this stage, you ask each of your friend to collect items of same type, put them in a large bowl, and label this large bowl with sum of individual bowl weights. Your friends cannot wait for the party to start, and immediately start 'reducing' small bowls. In the end, you have nice large bowls, with total weight of each vegetable labeled on it.
Your friends('compute nodes') just performed a Map-Reduce task to help you get started with cooking the Pasta. Since you were coordinating the entire exercise, you are "The Master" node of this Map-Reduce task. Each of your friends took roles of Mappers, Groupers and Reducers at different times. This example demonstrates the power of this technique.
This simple and powerful technique can be scaled very easily if more of your friends decide to join you.