版权声明:本文为博主原创文章,未经博主允许不得转载。 https://blog.csdn.net/zhuoganliwanjin/article/details/85060708
<!DOCTYPE html>
<html>
<head>
<meta charset="UTF-8" />
<title>Amchart-甘特图</title>
<style>
#chartdiv {
width: 100%;
max-height: 600px;
height: 100vh;
}
</style>
</head>
<body>
<div id="chartdiv"></div>
<script src="https://www.amcharts.com/lib/4/core.js"></script>
<script src="https://www.amcharts.com/lib/4/charts.js"></script>
<script src="https://www.amcharts.com/lib/4/themes/animated.js"></script>
<script>
am4core.useTheme(am4themes_animated);
var chart = am4core.create("chartdiv", am4charts.XYChart);
chart.paddingRight = 30;
chart.dateFormatter.inputDateFormat = "yyyy-MM-dd HH:mm";
var colorSet = new am4core.ColorSet();
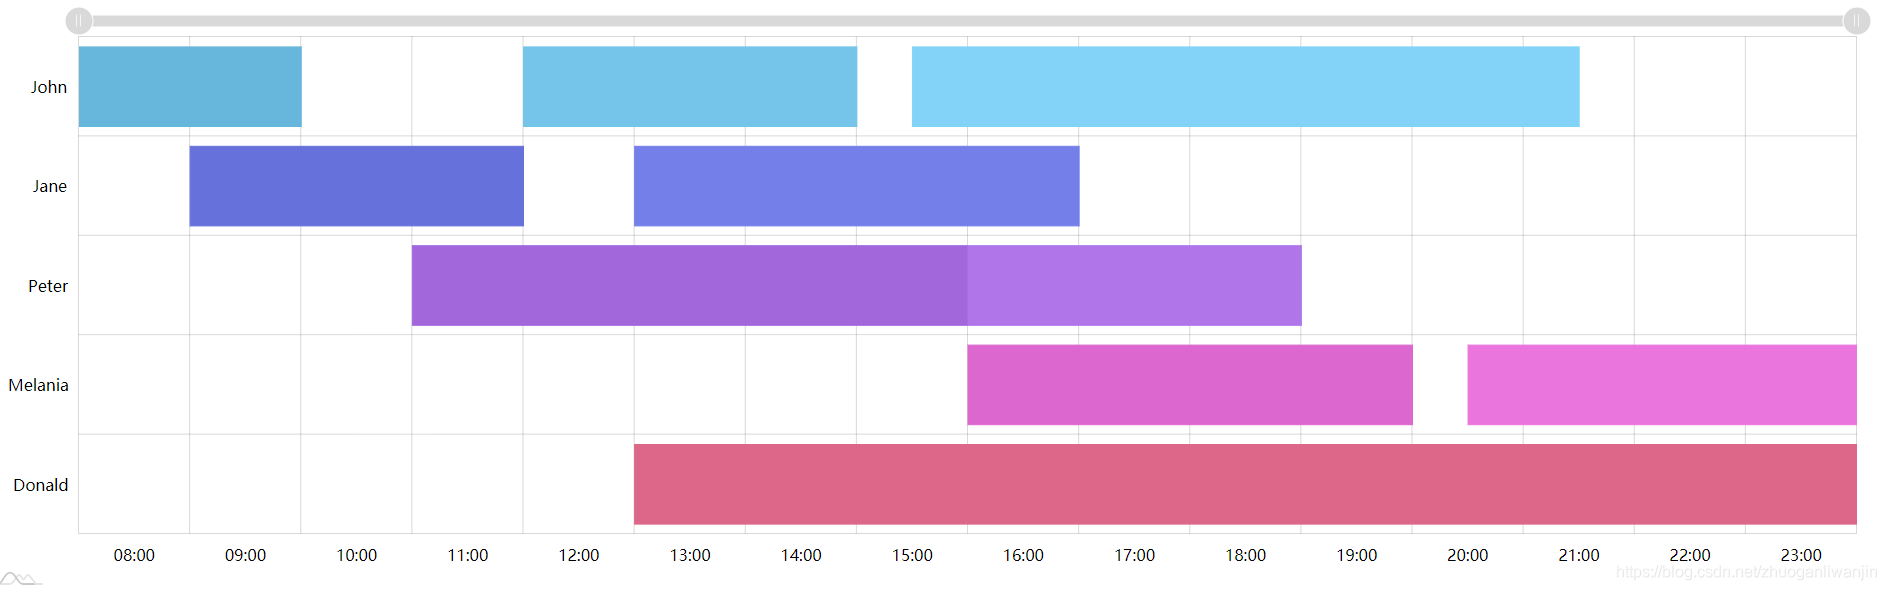
chart.data = [
{ "name": "John", fromDate: "2018-01-01 08:00", toDate: "2018-01-01 10:00", color: colorSet.getIndex(0).brighten(0) },
{ "name": "John", fromDate: "2018-01-01 12:00", toDate: "2018-01-01 15:00", color: colorSet.getIndex(0).brighten(0.4) },
{ "name": "John", fromDate: "2018-01-01 15:30", toDate: "2018-01-01 21:30", color: colorSet.getIndex(0).brighten(0.8) },
{ "name": "Jane", fromDate: "2018-01-01 09:00", toDate: "2018-01-01 12:00", color: colorSet.getIndex(2).brighten(0) },
{ "name": "Jane", fromDate: "2018-01-01 13:00", toDate: "2018-01-01 17:00", color: colorSet.getIndex(2).brighten(0.4) },
{ "name": "Peter", fromDate: "2018-01-01 11:00", toDate: "2018-01-01 16:00", color: colorSet.getIndex(4).brighten(0) },
{ "name": "Peter", fromDate: "2018-01-01 16:00", toDate: "2018-01-01 19:00", color: colorSet.getIndex(4).brighten(0.4) },
{ "name": "Melania", fromDate: "2018-01-01 16:00", toDate: "2018-01-01 20:00", color: colorSet.getIndex(6).brighten(0) },
{ "name": "Melania", fromDate: "2018-01-01 20:30", toDate: "2018-01-01 24:00", color: colorSet.getIndex(6).brighten(0.4) },
{ "name": "Donald", fromDate: "2018-01-01 13:00", toDate: "2018-01-01 24:00", color: colorSet.getIndex(8).brighten(0) }
]
var categoryAxis = chart.yAxes.push(new am4charts.CategoryAxis());
categoryAxis.dataFields.category = "name";
categoryAxis.renderer.grid.template.location = 0;
categoryAxis.renderer.inversed = true;
var dateAxis = chart.xAxes.push(new am4charts.DateAxis());
dateAxis.dateFormatter.dateFormat = "yyyy-MM-dd HH:mm";
dateAxis.renderer.minGridDistance = 70;
dateAxis.baseInterval = { count: 30, timeUnit: "minute" };
dateAxis.max = new Date(2018, 0, 1, 24, 0, 0, 0).getTime();
dateAxis.strictMinMax = true;
dateAxis.renderer.tooltipLocation = 0;
var series1 = chart.series.push(new am4charts.ColumnSeries());
series1.columns.template.width = am4core.percent(80);
series1.columns.template.tooltipText = "{name}: {openDateX} - {dateX}";
series1.dataFields.openDateX = "fromDate";
series1.dataFields.dateX = "toDate";
series1.dataFields.categoryY = "name";
series1.columns.template.propertyFields.fill = "color"; // get color from data
series1.columns.template.propertyFields.stroke = "color";
series1.columns.template.strokeOpacity = 1;
chart.scrollbarX = new am4core.Scrollbar();
chart.cursor = new am4charts.XYCursor();
chart.cursor.behavior = "panX";
</script>
</body>
</html>