本函数可以通过鼠标控制来弹出放大镜查看2D图片的细节。
Turns the mouse into a pop-up magnifying glass to look at details of 2D plots.
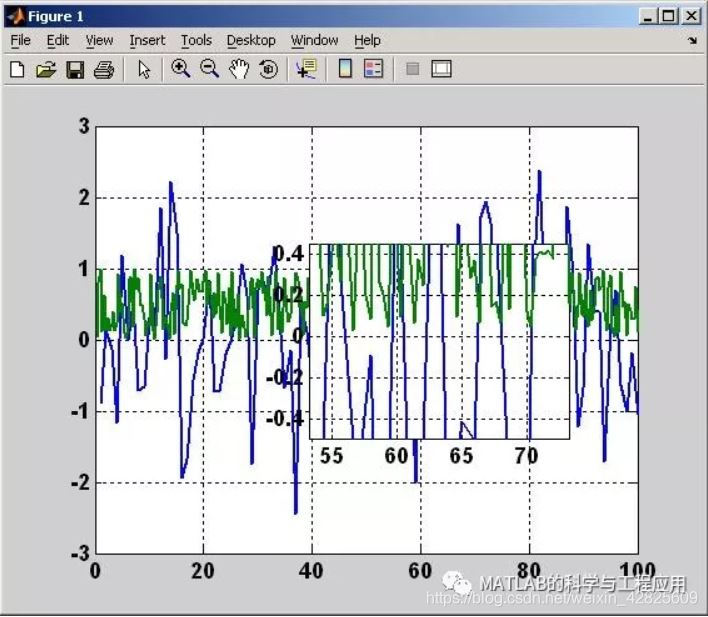
你是否曾经希望MATLAB拥有一个放大镜功能,这样就可以不用一次又一次地放大或缩小就能看到小块区域的细节?
Ever wish MATLAB had a magnifying glass so you could look at the details of a small region of your plots without having to zoom in and out again and again?
只要以感兴趣的图片作为当前图片运行’magnify.m’,然后使用鼠标左键来显示你控制的需要缩放的视图区域。
Just run ‘magnify.m’ with the figure of interest as the current figure, then use the left mouse button to bring up a magnified veiw that you control.
或者使用“Ctrl”键,同时点击图片弹出一个放大镜,释放后“锁定”到图片上(这样可以用于复制和打印图片)。
Or use the ‘Ctrl’ key while clicking to bring up a magnifying glass that ‘locks’ onto the figure when released (for use when copying and printing figures).
使用’<’ 和 '>'键可以将放大镜的尺寸缩小或增大。
Use the ‘<’ and ‘>’ keys to make the magnifying glass smaller or larger.
使用’-’ 和 '+'可以减小或增大缩放的尺度。
Use ‘-’ and ‘+’ to decrease or increase the magnification level.
源代码如下:
function magnify(f1)
%
%magnify(f1)
%
% Figure creates a magnification box when under the mouse
% position when a button is pressed. Press ‘+’/’-’ while
% button pressed to increase/decrease magnification. Press
% ‘>’/’<’ while button pressed to increase/decrease box size.
% Hold ‘Ctrl’ while clicking to leave magnification on figure.
%
% Example:
% plot(1:100,randn(1,100),(1:300)/3,rand(1,300)), grid on,
% magnify;
% Rick Hindman - 7/29/04
if (nargin == 0), f1 = gcf; end;
set(f1, …
‘WindowButtonDownFcn’, @ButtonDownCallback, …
‘WindowButtonUpFcn’, @ButtonUpCallback, …
‘WindowButtonMotionFcn’, @ButtonMotionCallback, …
‘KeyPressFcn’, @KeyPressCallback);
return;
function ButtonDownCallback(src,eventdata)
f1 = src;
a1 = get(f1,‘CurrentAxes’);
a2 = copyobj(a1,f1);
set(f1, …
  'UserData',[f1,a1,a2], ...

  'Pointer','fullcrosshair', ...

  'CurrentAxes',a2);
set(a2, …
  'UserData',[2,0.2], ...  %magnification, frame size

  'Color',get(a1,'Color'), ...

  'Box','on');
xlabel(’’); ylabel(’’); zlabel(’’); title(’’);
set(get(a2,‘Children’), …
'LineWidth', 2);
set(a1, …
'Color',get(a1,'Color')*0.95);
set(f1, …
'CurrentAxes',a1);
ButtonMotionCallback(src);
return;
function ButtonUpCallback(src,eventdata)
H = get(src,‘UserData’);
f1 = H(1); a1 = H(2); a2 = H(3);
set(a1, …
'Color',get(a2,'Color'));
set(f1, …
  'UserData',[], ...

  'Pointer','arrow', ...

  'CurrentAxes',a1);
if ~strcmp(get(f1,‘SelectionType’),‘alt’),
delete(a2);
end;
return;
function ButtonMotionCallback(src,eventdata)
H = get(src,‘UserData’);
if ~isempty(H)
  f1 = H(1); a1 = H(2); a2 = H(3);

  a2_param = get(a2,'UserData');

  f_pos = get(f1,'Position');

  a1_pos = get(a1,'Position');


  [f_cp, a1_cp] = pointer2d(f1,a1);


  set(a2,'Position',[(f_cp./f_pos(3:4)) 0 0]+a2_param(2)*a1_pos(3)*[-1 -1 2 2]);

  a2_pos = get(a2,'Position');


set(a2,'XLim',a1_cp(1)+(1/a2_param(1))*(a2_pos(3)/a1_pos(3))*diff(get(a1,'XLim'))*[-0.5 0.5]);

set(a2,'YLim',a1_cp(2)+(1/a2_param(1))*(a2_pos(4)/a1_pos(4))*diff(get(a1,'YLim'))*[-0.5 0.5]);
end;
return;
function KeyPressCallback(src,eventdata)
H = get(gcf,‘UserData’);
if ~isempty(H)
  f1 = H(1); a1 = H(2); a2 = H(3);

  a2_param = get(a2,'UserData');

  if (strcmp(get(f1,'CurrentCharacter'),'+') | strcmp(get(f1,'CurrentCharacter'),'='))

     a2_param(1) = a2_param(1)*1.2;

  elseif (strcmp(get(f1,'CurrentCharacter'),'-') | strcmp(get(f1,'CurrentCharacter'),'_'))

     a2_param(1) = a2_param(1)/1.2;

  elseif (strcmp(get(f1,'CurrentCharacter'),'<') | strcmp(get(f1,'CurrentCharacter'),','))

     a2_param(2) = a2_param(2)/1.2;

  elseif (strcmp(get(f1,'CurrentCharacter'),'>') | strcmp(get(f1,'CurrentCharacter'),'.'))

     a2_param(2) = a2_param(2)*1.2;

  end;

  set(a2,'UserData',a2_param);

ButtonMotionCallback(src);
end;
return;
% Included for completeness (usually in own file)
function [fig_pointer_pos, axes_pointer_val] = pointer2d(fig_hndl,axes_hndl)
%
%pointer2d(fig_hndl,axes_hndl)
%
% Returns the coordinates of the pointer (in pixels)
% in the desired figure (fig_hndl) and the coordinates
% in the desired axis (axes coordinates)
%
% Example:
% figure(1),
% hold on,
% for i = 1:1000,
% [figp,axp]=pointer2d;
% plot(axp(1),axp(2),’.’,‘EraseMode’,‘none’);
% drawnow;
% end;
% hold off
% Rick Hindman - 4/18/01
if (nargin == 0), fig_hndl = gcf; axes_hndl = gca; end;
if (nargin == 1), axes_hndl = get(fig_hndl,‘CurrentAxes’); end;
set(fig_hndl,‘Units’,‘pixels’);
pointer_pos = get(0,‘PointerLocation’); %pixels {0,0} lower left
fig_pos = get(fig_hndl,‘Position’); %pixels {l,b,w,h}
fig_pointer_pos = pointer_pos - fig_pos([1,2]);
set(fig_hndl,‘CurrentPoint’,fig_pointer_pos);
if (isempty(axes_hndl)),
axes_pointer_val = [];
elseif (nargout == 2),
axes_pointer_line = get(axes_hndl,'CurrentPoint');

axes_pointer_val = sum(axes_pointer_line)/2;
end;
源码下载地址:
http://page5.dfpan.com/fs/dlc9j2b21329116d4c7/
更多精彩文章请关注微信号: