现在HelloCharts支持以下chart类型:
Line chart(cubic lines, filled lines, scattered points)(线图)
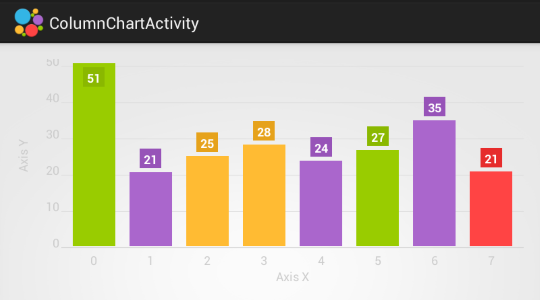
Column chart(grouped, stacked, negative values)(柱形图)
Pie chart(饼图)
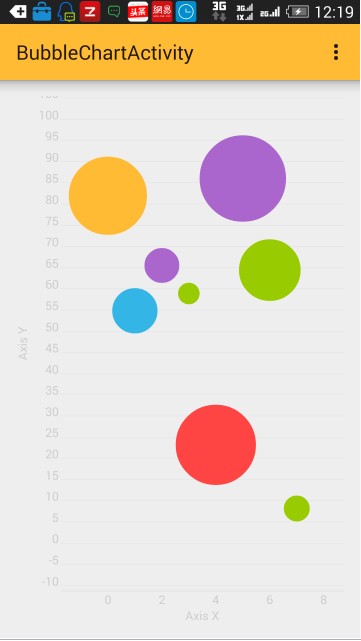
Bubble chart(泡泡图)
Combo chart(columns/lines)(柱图和线图的组合图)
Preview charts(for column chart and line chart)(预览图这个功能最牛逼,我还没用呢,见下图) 
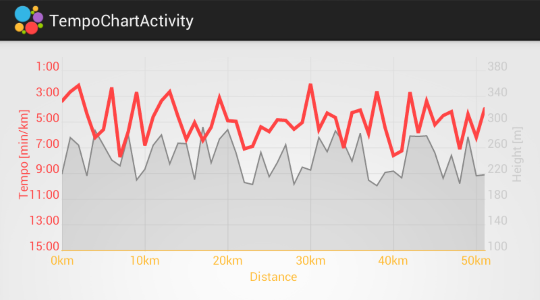
这样的效果和界面我只能说“天斧神功”了。
OK闲话说完该看一下怎么用了。
首先libs添加:
hellocharts-library-1.5.8.jar
给出地址:http://download.csdn.net/detail/u012534831/9531494
下来,XML添加一下布局。
 1. <lecho.lib.hellocharts.view.LineChartView
            android:id="@+id/line_chart"
            android:layout_width="fill_parent"
            android:layout_height="300dp"/>
- 1
- 2
- 3
- 4
- 5
- 6
然后一个是横坐标,一个是数据点数组。
private LineChartView lineChart;

    String[] date = {"10-22","11-22","12-22","1-22","6-22","5-23","5-22","6-22","5-23","5-22"};//X轴的标注
    int[] score= {50,42,90,33,10,74,22,18,79,20};//图表的数据点
    private List<PointValue> mPointValues = new ArrayList<PointValue>();
private List<AxisValue> mAxisXValues = new ArrayList<AxisValue>();- 1
- 2
- 3
- 4
- 5
- 6
下来oncreate中3个方法:
 protected void onCreate(Bundle savedInstanceState) {
        super.onCreate(savedInstanceState);
        setContentView(R.layout.activity_main);
        lineChart = (LineChartView)findViewById(R.id.line_chart);
        getAxisXLables();//获取x轴的标注
        getAxisPoints();//获取坐标点
        initLineChart();//初始化
}- 1
- 2
- 3
- 4
- 5
- 6
- 7
- 8
/**
     * 设置X 轴的显示
     */
    private void getAxisXLables(){
        for (int i = 0; i < date.length; i++) {
            mAxisXValues.add(new AxisValue(i).setLabel(date[i]));
        }
    }
    /**
     * 图表的每个点的显示
     */
    private void getAxisPoints(){
        for (int i = 0; i < weather.length; i++) {
            mPointValues.add(new PointValue(i, weather[i]));
} - 1
- 2
- 3
- 4
- 5
- 6
- 7
- 8
- 9
- 10
- 11
- 12
- 13
- 14
- 15
private void initLineChart(){
        Line line = new Line(mPointValues).setColor(Color.parseColor("#FFCD41"));  //折线的颜色(橙色)
        List<Line> lines = new ArrayList<Line>();
        line.setShape(ValueShape.CIRCLE);//折线图上每个数据点的形状  这里是圆形 (有三种 :ValueShape.SQUARE  ValueShape.CIRCLE  ValueShape.DIAMOND)
        line.setCubic(false);//曲线是否平滑,即是曲线还是折线
        line.setFilled(false);//是否填充曲线的面积
        line.setHasLabels(true);//曲线的数据坐标是否加上备注
//      line.setHasLabelsOnlyForSelected(true);//点击数据坐标提示数据(设置了这个line.setHasLabels(true);就无效)
        line.setHasLines(true);//是否用线显示。如果为false 则没有曲线只有点显示
        line.setHasPoints(true);//是否显示圆点 如果为false 则没有原点只有点显示(每个数据点都是个大的圆点)
        lines.add(line);
        LineChartData data = new LineChartData();
        data.setLines(lines);

        //坐标轴
        Axis axisX = new Axis(); //X轴
        axisX.setHasTiltedLabels(true);  //X坐标轴字体是斜的显示还是直的,true是斜的显示
        axisX.setTextColor(Color.WHITE);  //设置字体颜色
      //axisX.setName("date");  //表格名称
        axisX.setTextSize(10);//设置字体大小
        axisX.setMaxLabelChars(8); //最多几个X轴坐标,意思就是你的缩放让X轴上数据的个数7<=x<=mAxisXValues.length
        axisX.setValues(mAxisXValues);  //填充X轴的坐标名称
        data.setAxisXBottom(axisX); //x 轴在底部
      //data.setAxisXTop(axisX);  //x 轴在顶部
        axisX.setHasLines(true); //x 轴分割线

      // Y轴是根据数据的大小自动设置Y轴上限(在下面我会给出固定Y轴数据个数的解决方案)
        Axis axisY = new Axis();  //Y轴
        axisY.setName("");//y轴标注
        axisY.setTextSize(10);//设置字体大小
        data.setAxisYLeft(axisY);  //Y轴设置在左边
      //data.setAxisYRight(axisY);  //y轴设置在右边


        //设置行为属性,支持缩放、滑动以及平移
        lineChart.setInteractive(true);
        lineChart.setZoomType(ZoomType.HORIZONTAL);
        lineChart.setMaxZoom((float) 2);//最大方法比例
        lineChart.setContainerScrollEnabled(true, ContainerScrollType.HORIZONTAL);
        lineChart.setLineChartData(data);
        lineChart.setVisibility(View.VISIBLE);
        /**注:下面的7,10只是代表一个数字去类比而已
         * 当时是为了解决X轴固定数据个数。见(http://forum.xda-developers.com/tools/programming/library-hellocharts-charting-library-t2904456/page2);
         */
        Viewport v = new Viewport(lineChart.getMaximumViewport());
          v.left = 0;
          v.right= 7;
          lineChart.setCurrentViewport(v);
}- 1
- 2
- 3
- 4
- 5
- 6
- 7
- 8
- 9
- 10
- 11
- 12
- 13
- 14
- 15
- 16
- 17
- 18
- 19
- 20
- 21
- 22
- 23
- 24
- 25
- 26
- 27
- 28
- 29
- 30
- 31
- 32
- 33
- 34
- 35
- 36
- 37
- 38
- 39
- 40
- 41
- 42
- 43
- 44
- 45
- 46
- 47
- 48
- 49
Viewport v = new Viewport(lineChart.getMaximumViewport());
          v.left = 0;
          v.right= 7;
lineChart.setCurrentViewport(v); - 1
- 2
- 3
- 4
   这4句代码可以设置X轴数据的显示个数(x轴0-7个数据),
  1    当数据点个数小于(29)的时候,缩小到极致hellochart默认的是所有显示。
  2    当数据点个数大于(29)的时候,
     2.1  若不设置axisX.setMaxLabelChars(int count)这句话,则会自动适配X轴所能显示的尽量合适的数据个数。
     2.2  若设置axisX.setMaxLabelChars(int count)这句话, 33个数据点测试,
            2.2.1  若 axisX.setMaxLabelChars(10); 里面的10大于v.right= 7; 里面的7,则 刚开始X轴显示7条数据,然后缩放的时候X轴的个数会保证大于7小于10
            2.2.2  若小于v.right= 7;中的7,反正我感觉是这两句都好像失效了的样子 - -!
若这儿不设置 v.right= 7; 这句话,则图表刚开始就会尽可能的显示所有数据,交互性太差- 1
- 2
- 3
- 4
- 5
- 6
- 7
- 8
下面看一下固定Y轴个数的解决方案:
例:想要固定Y轴数据从0-100
Axis axisY = new Axis().setHasLines(true);
axisY.setMaxLabelChars(6);//max label length, for example 60
List<AxisValue> values = new ArrayList<>();
for(int i = 0; i < 100; i+= 10){
    AxisValue value = new AxisValue(i);
    String label = "";
    value.setLabel(label);
    values.add(value);
}
axisY.setValues(values);- 1
- 2
- 3
- 4
- 5
- 6
- 7
- 8
- 9
- 10
可见,只要自己去按照比例去分割数据就行了。
好,基本就到这儿。
源码github地址:https://github.com/qht1003077897/hellocharts-line.git
csdn下载地址:http://download.csdn.net/detail/u012534831/9531702
出处:http://blog.csdn.net/u012534831/article/details/51505683