sklearn.metrics.auc
作用:计算AUC(Area Under the Curve)
metrics.roc_curve
作用:计算 ROC(Receiver operating characteristic)
注意: this implementation is restricted to the binary classification task
sklearn.metrics.roc_curve(y_true, y_score, pos_label=None, sample_weight=None, drop_intermediate=True)
parameter :
-
y_true: array, shape = [n_samples] True binary labels. If labels are not either {-1, 1} or {0, 1}, then pos_label should be explicitly given -
y_score: array, shape = [n_samples] -
pos_label:int or str, default=None, Label considered as positive and others are considered negative.
Returns
fpr: false positive ratestpr: true positive ratesthresholds: array, shape = [n_thresholds]
例子:
pos_label = 1即表示标签为1的是正样本,其余的都是负样本,因为这个只能做二分类。
import numpy as np
from sklearn import metrics
y = np.array([1, 1, 2, 2,3,3])
pred = np.array([0.1, 0.4, 0.35, 0.8,0.1,0.8])
fpr, tpr, thresholds = metrics.roc_curve(y, pred, pos_label = 1)
metrics.auc(fpr, tpr)
0.3125
sklearn.metrics.roc_auc_score
作用:Compute Area Under the Receiver Operating Characteristic Curve (ROC AUC) from prediction scores
注意:this implementation is restricted to the binary classification task or multilabel classification task inlabel indicator format.
sklearn.metrics.roc_auc_score(y_true, y_score, average=’macro’, sample_weight=None, max_fpr=None)
Parameters:
y_true : array, shape = [n_samples] or [n_samples, n_classes]
y_score : array, shape = [n_samples] or [n_samples, n_classes]
average : string, [None, ‘micro’, ‘macro’ (default), ‘samples’, ‘weighted’],If None, the scores for each class are returned. Otherwise, this determines the type of averaging performed on the data。
Returns:
auc : float
### roc_auc_score
import numpy as np
from sklearn.metrics import roc_auc_score
y_true = np.array([0, 0, 1, 1])
y_scores = np.array([0.1, 0.4, 0.35, 0.8])
roc_auc_score(y_true, y_scores)


0.75
roc_auc_score 是 预测得分曲线下的 auc,在计算的时候调用了 auc;
def _binary_roc_auc_score(y_true, y_score, sample_weight=None):
if len(np.unique(y_true)) != 2:
raise ValueError("Only one class present in y_true. ROC AUC score "
"is not defined in that case.")

fpr, tpr, tresholds = roc_curve(y_true, y_score,
sample_weight=sample_weight)
return auc(fpr, tpr, reorder=True)
所以不能用在多分类问题上。
多分类问题的auc计算例子:
import numpy as np
import matplotlib.pyplot as plt
from itertools import cycle
from sklearn import svm,datasets
from sklearn.metrics import roc_curve, auc
from sklearn.model_selection import train_test_split
from sklearn.preprocessing import label_binarize
from sklearn.multiclass import OneVsRestClassifier
from scipy import interp
导入数据:
iris = datasets.load_iris()
X = iris.data
y = iris.target
对训练标签做标签二值化运算(one-hot编码):
# Binarize the output
y = label_binarize(y,classes=[0,1,2])
n_classes = y.shape[1]
n_classes


3
对每个数据在尾部加入噪音:
# Add noisy features to make the problem harder
random_state = np.random.RandomState(0)
n_samples, n_features = X.shape
X = np.c_[X,random_state.randn(n_samples,200 * n_features)]
注:np.c_
np.c_[random_state.randn(2,2),[[0,0],[1,1]]]


array([[ 0.73381936,  0.26909417,  0.        ,  0.        ],
       [ 1.07274021, -0.9826661 ,  1.        ,  1.        ]])
划分数据集:
# shuffle and split training and test sets
X_train, X_test, y_train, y_test = train_test_split(X,y,test_size=.5,random_state=0)
fit一个分类器:
# Learn to predict each class against the other
classifier = OneVsRestClassifier(svm.SVC(kernel='linear',probability=True,
                                        random_state=random_state))
y_score = classifier.fit(X_train,y_train).decision_function(X_test)
注:decision_function(X):
Returns the distance of each sample from the decision boundary for each class.
计算每一个类别的ROC与AUC:
# Compute ROC curve and ROC area for each class
fpr = dict()
tpr = dict()
roc_auc = dict()
for i in range(n_classes):
    # 取出来的是各个类的测试值和预测值
    fpr[i], tpr[i],_ = roc_curve(y_test[:, i],y_score[:,i])
    roc_auc[i] = auc(fpr[i], tpr[i])
#Compute micro-average ROC curve and ROC area
#类总和的基础上平均的ROC 和 AUC
fpr["micro"],tpr["micro"],_ = roc_curve(y_test.ravel(), y_score.ravel())
roc_auc["micro"] = auc(fpr["micro"],tpr["micro"])
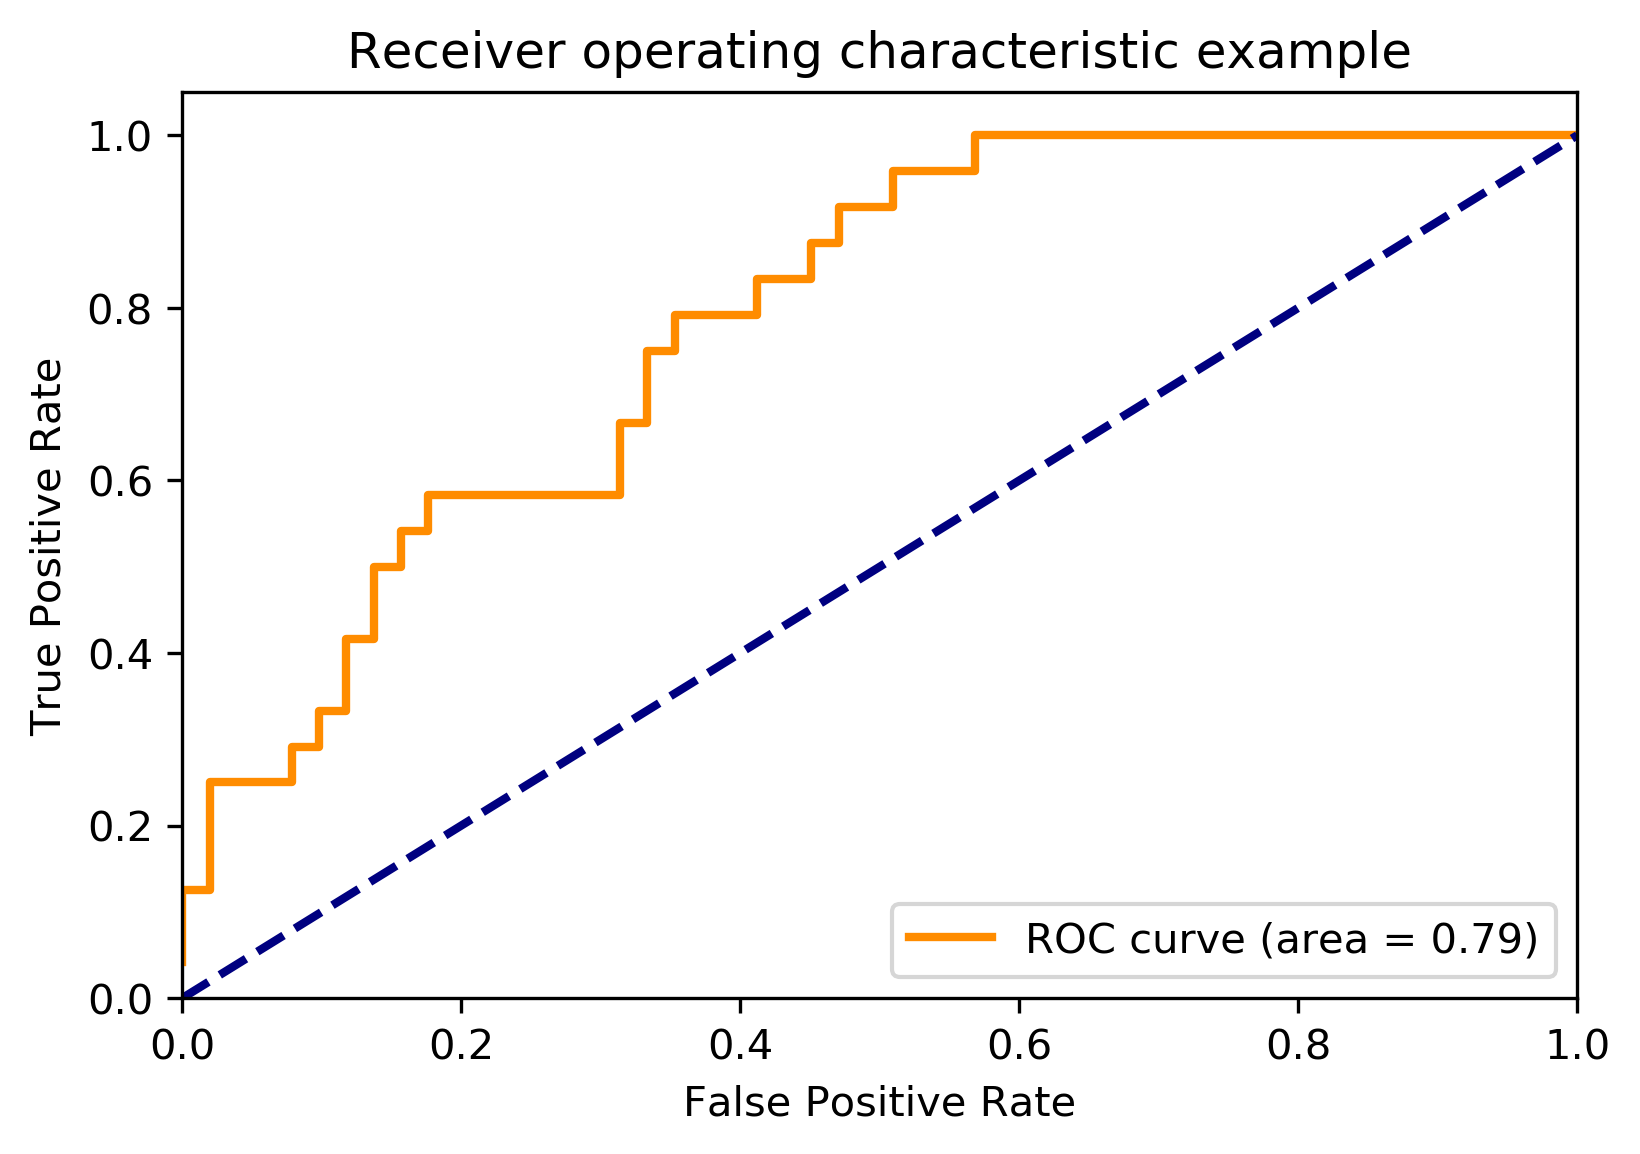
绘图:
plt.rcParams['savefig.dpi'] = 300 #图片像素
plt.rcParams['figure.dpi'] = 300 #分辨率
plt.figure()
# linewidth
lw = 2
plt.plot(fpr[2], tpr[2], color='darkorange',
         lw=lw, label='ROC curve (area = %0.2f)' % roc_auc[2])
plt.plot([0, 1], [0, 1], color='navy', lw=lw, linestyle='--')
plt.xlim([0.0, 1.0])
plt.ylim([0.0, 1.05])
plt.xlabel('False Positive Rate')
plt.ylabel('True Positive Rate')
plt.title('Receiver operating characteristic example')
plt.legend(loc="lower right")
plt.show()
# Compute macro-average ROC curve and ROC area
# First aggregate all false positive rates
all_fpr = np.unique(np.concatenate([fpr[i] for i in range(n_classes)]))
# Then interpolate all ROC curves at this points
mean_tpr = np.zeros_like(all_fpr)
for i in range(n_classes):
mean_tpr += interp(all_fpr, fpr[i], tpr[i])
# Finally average it and compute AUC
mean_tpr /= n_classes
fpr["macro"] = all_fpr
tpr["macro"] = mean_tpr
roc_auc["macro"] = auc(fpr["macro"], tpr["macro"])
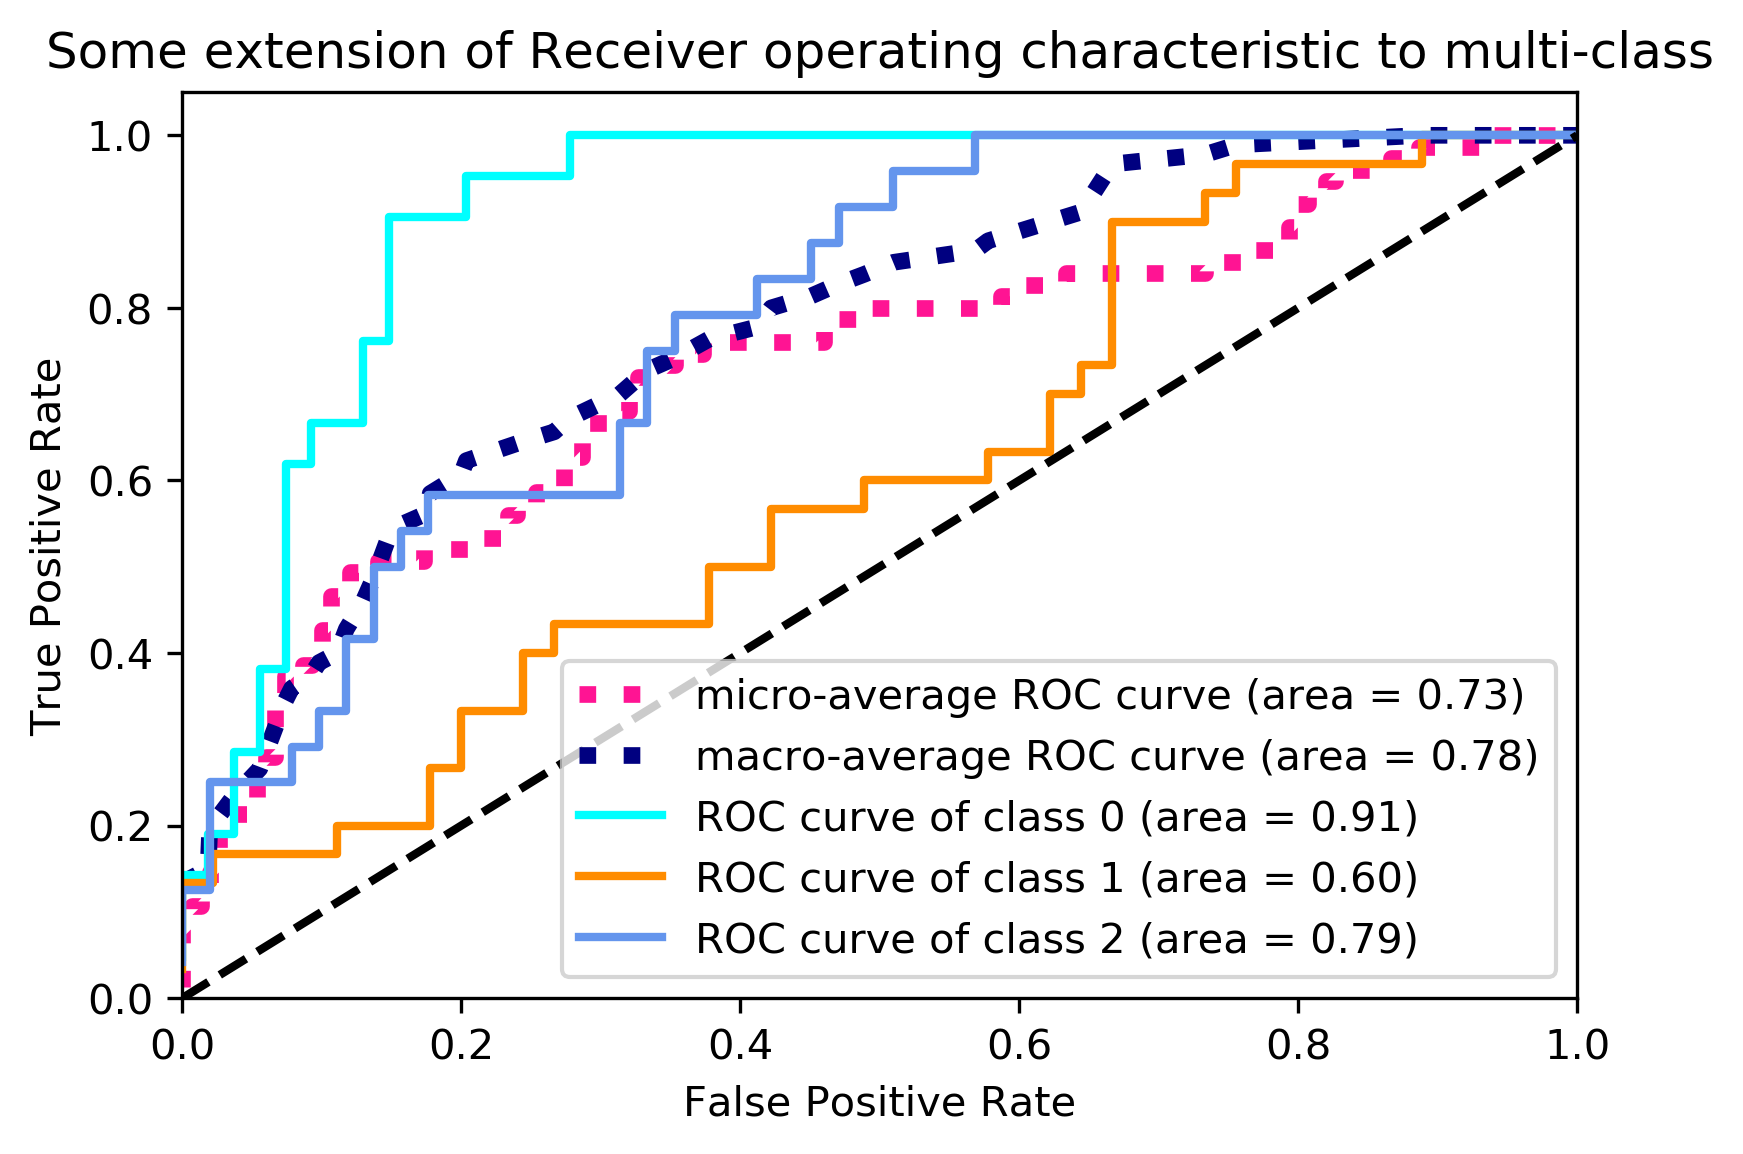
# Plot all ROC curves
plt.figure()
plt.plot(fpr["micro"], tpr["micro"],
label='micro-average ROC curve (area = {0:0.2f})'
''.format(roc_auc["micro"]),
color='deeppink', linestyle=':', linewidth=4)
plt.plot(fpr["macro"], tpr["macro"],
label='macro-average ROC curve (area = {0:0.2f})'
''.format(roc_auc["macro"]),
color='navy', linestyle=':', linewidth=4)
colors = cycle(['aqua', 'darkorange', 'cornflowerblue'])
for i, color in zip(range(n_classes), colors):
plt.plot(fpr[i], tpr[i], color=color, lw=lw,
label='ROC curve of class {0} (area = {1:0.2f})'
''.format(i, roc_auc[i]))
plt.plot([0, 1], [0, 1], 'k--', lw=lw)
plt.xlim([0.0, 1.0])
plt.ylim([0.0, 1.05])
plt.xlabel('False Positive Rate')
plt.ylabel('True Positive Rate')
plt.title('Some extension of Receiver operating characteristic to multi-class')
plt.legend(loc="lower right")
plt.show()