import numpy as np
X = np.mgrid[-5:5:5]
X1 = np.mgrid[-5:5:5j]
Y1,Y2 = np.mgrid[-5:5,10:17]
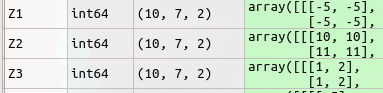
Z1,Z2,Z3 = np.mgrid[-5:5,10:17,1:3]
print(X)
print(X1)
print(Y1,Y2)输出:
[-5 0]
[-5. -2.5 0. 2.5 5. ]
(array([[-5, -5, -5, -5, -5, -5, -5],
[-4, -4, -4, -4, -4, -4, -4],
[-3, -3, -3, -3, -3, -3, -3],
[-2, -2, -2, -2, -2, -2, -2],
[-1, -1, -1, -1, -1, -1, -1],
[ 0, 0, 0, 0, 0, 0, 0],
[ 1, 1, 1, 1, 1, 1, 1],
[ 2, 2, 2, 2, 2, 2, 2],
[ 3, 3, 3, 3, 3, 3, 3],
[ 4, 4, 4, 4, 4, 4, 4]]), array([[10, 11, 12, 13, 14, 15, 16],
[10, 11, 12, 13, 14, 15, 16],
[10, 11, 12, 13, 14, 15, 16],
[10, 11, 12, 13, 14, 15, 16],
[10, 11, 12, 13, 14, 15, 16],
[10, 11, 12, 13, 14, 15, 16],
[10, 11, 12, 13, 14, 15, 16],
[10, 11, 12, 13, 14, 15, 16],
[10, 11, 12, 13, 14, 15, 16],
[10, 11, 12, 13, 14, 15, 16]]))
Meshgrid
import numpy as np
import matplotlib.pyplot as plt
from matplotlib import cm
from mpl_toolkits.mplot3d import Axes3D

x = np.arange(-5, 5, 0.1)
y = np.arange(-5, 5, 0.1)
xx, yy = np.meshgrid(x, y)
z = np.sin(xx**2 + yy**2) / (xx**2 + yy**2)

print(xx)
print(yy)

h = plt.contourf(x,y,z)

fig = plt.figure()
ax = Axes3D(fig)
ax.plot_surface(xx, yy, z, rstride=1, cstride=1, cmap=cm.viridis)

plt.show()
输出
[[-5. -4.9 -4.8 ..., 4.7 4.8 4.9]
[-5. -4.9 -4.8 ..., 4.7 4.8 4.9]
[-5. -4.9 -4.8 ..., 4.7 4.8 4.9]
...,
[-5. -4.9 -4.8 ..., 4.7 4.8 4.9]
[-5. -4.9 -4.8 ..., 4.7 4.8 4.9]
[-5. -4.9 -4.8 ..., 4.7 4.8 4.9]]
[[-5. -5. -5. ..., -5. -5. -5. ]
[-4.9 -4.9 -4.9 ..., -4.9 -4.9 -4.9]
[-4.8 -4.8 -4.8 ..., -4.8 -4.8 -4.8]
...,
[ 4.7 4.7 4.7 ..., 4.7 4.7 4.7]
[ 4.8 4.8 4.8 ..., 4.8 4.8 4.8]
[ 4.9 4.9 4.9 ..., 4.9 4.9 4.9]]


可以看到,mgrid是先向行的方向广播(重复),再向列的方向广播。与其相反的是:meshgrid是先向列的方向广播,后向行的方向广播。
这类函数的核心思想是遍历每一个坐标网格,每一个坐标网格都有一个坐标(二维向量)与其对应。3D情况当然是每个坐标是一个三维向量。