1. 概述
之前两篇日志,我们系统性的介绍了决策树的构建算法、构建流程、展示与决策:
决策树的构建算法 – ID3 与 C4.5 算法
决策树的构建、展示与决策
本文,我们来介绍如何使用 sklearn 构建决策树。
2. sklearn
之前我们已经介绍和使用过 python 的 sklearn 包:
k 近邻算法
sklearn 也提供了决策树明星,用于解决分类和回归问题。
http://scikit-learn.org/stable/modules/generated/sklearn.tree.DecisionTreeClassifier.html。
3. sklearn.tree.DecisionTreeClassifier 构造参数
sklearn.tree.DecisionTreeClassifier 类就是我们需要的决策树类,它具有如下构造参数:
####sklearn.tree.DecisionTreeClassifier 类构造参数
| 参数名 | 类型 | 可选参数 | 默认值 | 说明 |
|---|---|---|---|---|
| criterion | string | ‘gini’、‘entropy’ | ‘gini’ | 构建决策树算法,基尼不纯度准则(CART 算法)或信息熵准则(C4.5算法) |
| splitter | string | ‘best’、‘random’ | ‘random’ | 决策树分支选取原则,全局最优或选取随机局部最优点 |
| max_depth | int | 正整数或 None | None | 树最大深度,None 表示直到所有叶子都完成划分,需要参考 min_samples_split 与 min_samples_leaf |
| min_samples_split | int 或 float | 正整数或小数 | 2 | 整数指的是内部节点最少包含样本数,浮点数表示内部节点最少包含样本数为 min_samples_split * n_samples,0.18 版本后才支持浮点数 |
| min_samples_leaf | int 或 float | 正整数或小数 | 1 | 整数指的是叶子节点最少包含样本数,浮点数表示叶子节点最少包含样本数为 min_samples_leaf * n_samples |
| min_weight_fraction_leaf | float | 小数 | 0 | 叶节点最小样本总权重 |
| max_features | int, float, string 或 None | 可选参数见下文 | None | 节点分裂时参与判断的最大特征数,取值详见下面讲解 |
| random_state | int, 对象或 None | 正整数、RandomState 对象或 None | None | 随机数种子值、随机数生成器对象或默认的 numpy 随机数生成器 |
| max_leaf_nodes | int 或 None | 正整数或 None | None | 最大叶节点数 |
| min_impurity_decrease | float | 小于1正浮点数 | 0 | 节点划分最小不纯度,只有基尼系数、信息增益比大于等于该值才分裂,0.19.1版本以前字段名为min_impurity_split |
| class_weight | dict, 字典的list, string 或 None | 见下文 | None | 类别权重,取值见下文 |
| presort | bool | True 或 False | False | 是否重排序以提高运行速度 |
3.1. max_features 参数取值
max_features 参数指节点分裂时参与判断的最大特征数,可以的取值有:
- int – 特征个数
- float – 占所有特征的百分比
- ‘auto’ – 特征总数的开方
- ‘sqrt’ – 特征总数的开方
- ‘log2’ – 特征总数的 log2
- None – 特征总数
3.2. class_weight 参数取值
指定样本各类别的的权重。
可选参数有:
- None – 所有样本类别权重均为 1
- dict – 对应单条输出结果,每个样本类别的权重:{0: 1, 1: 5}
- 字典的 list – 对应多条输出结果: [{0: 1, 1: 1}, {0: 1, 1: 5}, {0: 1, 1: 1}, {0: 1, 1: 1}]
- ‘balanced’ – sklearn 按照样本量自动计算权重:样本数/(类别数 * np.bincount(y))
3.3. 参数优化
模型的构建参数可以从以下条件考虑优化:
- splitter – 特征划分点选择标准,样本量大时,使用 best 会导致训练时间过长,推荐 random
- max_depth – 决策树的最大深度,样本量大时,推荐限制最大深度取 10 到 100 之间
- min_weight_fraction_leaf – 叶子节点最小的样本总权重,如果我们有较多样本有缺失值,或者分类树样本的分布类别偏差很大,需要调整叶子节点的样本权重
- max_leaf_nodes – 最大叶子节点数,设定这个参数可以防止过拟合,如果特征分成多的话,可以加以限制,具体的值可以通过交叉验证得到
- class_weight – 指定样本各类别的的权重,主要是为了防止训练集某些类别的样本过多,导致训练的决策树过于偏向这些类别
- presort – 样本量大的时候设置为 True 会降低执行效率,推荐置为 False
4. sklearn.tree.DecisionTreeClassifier 的属性
sklearn.tree.DecisionTreeClassifier 具有以下成员属性。
####sklearn.tree.DecisionTreeClassifier 的成员属性
| 属性名 | 类型 | 说明 |
|---|---|---|
| classes_ | array 或 array 的 list | 对于单条输出为 array,结果类别数组 |
| feature_importances_ | array | 特征重要性 |
| max_features_ | int | 用于推断的最大特征数 |
| n_classes_ | int 或 list | 对于单挑输出为 int,结果类别数 |
| n_features_ | int | 训练完成后赋值,特征数 |
| n_outputs_ | int | 训练完成后赋值,输出结果数 |
| tree_ | 对象 | 训练生成的决策树 |
| feature_importances_ | ndarray | 特征相关度 |
5. sklearn.tree.DecisionTreeClassifier 成员函数
- apply(X[, check_input]) – 返回样本在叶子节点中的索引,check_input 为 False 则绕过所有参数检测
- decision_path(X[, check_input]) – 返回样本的决策路径
- fit(X, y[, sample_weight, check_input, …]) – 训练样本
- get_params([deep=True]) – 获取全部参数,deep 为 True 则包含子对象
- predict(X[, check_input]) – 预测 X 所属分类
- predict_log_proba(X) – 预测 X 所属分类的对数几率
- predict_proba(X[, check_input=True]) – 预测 X 属于所有分类的可能性,check_input 为 False 则绕过所有参数检测
- score(X, y[, sample_weight]) – 为模型打分,可以通过 sample_weight 参数指定样本权重
- set_params(**params) – 设置所有参数
6. 用 sklearn 解决高尔夫预测问题
还是回到我们上一篇文章中的根据天气预测是否打高尔夫球的问题:
# -*- coding: UTF-8 -*-
# {{{
import numpy
from sklearn.tree import DecisionTreeClassifier


def createDataSet():
    """
    创建数据集

    :return: 数据集与特征集
    """
    dataSet = [['hot', 'sunny', 'high', 'false', 'no'],
               ['hot', 'sunny', 'high', 'true', 'no'],
               ['hot', 'overcast', 'high', 'false', 'yes'],
               ['cool', 'rain', 'normal', 'false', 'yes'],
               ['cool', 'overcast', 'normal', 'true', 'yes'],
               ['mild', 'sunny', 'high', 'false', 'no'],
               ['cool', 'sunny', 'normal', 'false', 'yes'],
               ['mild', 'rain', 'normal', 'false', 'yes'],
               ['mild', 'sunny', 'normal', 'true', 'yes'],
               ['mild', 'overcast', 'high', 'true', 'yes'],
               ['hot', 'overcast', 'normal', 'false', 'yes'],
               ['mild', 'sunny', 'high', 'true', 'no'],
               ['cool', 'sunny', 'normal', 'true', 'no'],
               ['mild', 'sunny', 'high', 'false', 'yes']]
    labels = ['日期', '气候', '天气', '气温', '寒冷']
    return dataSet, labels


if __name__ == '__main__':
    dataSet, labels = createDataSet()
    xList = list()
    yList = list()
    featureDict = dict()
    for dataList in dataSet:
        xTempList = list()
        for i in range(len(dataList) - 1):
            if type(dataList[i]).__name__ == 'str':
                if dataList[i] not in featureDict.get(i, list()):
                    if featureDict.get(i) is None:
                        featureDict[i] = list()
                    featureDict[i].append(dataList[i])
                xTempList.append(featureDict[i].index(dataList[i]))
            else:
                xTempList.append(dataList[i])
        xList.append(xTempList)
        if type(dataList[-1]).__name__ == 'str':
            if dataList[-1] not in featureDict.get(len(dataList) - 1, list()):
                if featureDict.get(len(dataList) - 1) is None:
                    featureDict[len(dataList) - 1] = list()
                featureDict.get(len(dataList) - 1, list()).append(dataList[-1])
            yList.append(featureDict[len(dataList) - 1].index(dataList[-1]))
        else:
            yList.append(dataList[-1])

    dt = DecisionTreeClassifier()
    dt.fit(numpy.array(xList), numpy.array(yList))

    xTest = [['hot', 'overcast', 'high', 'false'], ['mild', 'sunny', 'high', 'true']]
    xTestList = list()
    for featureValList in xTest:
        xTempList = list()
        for i in range(len(featureValList)):
            featureVal = featureValList[i]
            if type(featureVal).__name__ == 'str':
                if featureVal not in featureDict[i]:
                    print("测试数据异常:" + featureVal)
                index = featureDict[i].index(featureVal)
                xTempList.append(index)
            else:
                xTempList.append(featureVal)
        xTestList.append(xTempList)
    result = dt.predict(xTestList)
    for i in result:
        print(featureDict[len(dataSet[0]) - 1][i])
# }}}
输出了:
yes
no
7. 特征序列化 – sklearn.preprocessing.LabelEncoder
因为 sklearn 只能进行数值型运算,不能处理我们的字符串样本和结果,所以上面的代码中我们简单地进行了样本与数值的映射、存储和转化的序列化过程。
事实上,sklearn 也提供了序列化工具 – sklearn.preprocessing.LabelEncoder:
http://scikit-learn.org/stable/modules/generated/sklearn.preprocessing.LabelEncoder.html。
可以方便的对结果进行转化:
>>> from sklearn import preprocessing
>>> le = preprocessing.LabelEncoder()
>>> le.fit(["paris", "paris", "tokyo", "amsterdam"])
LabelEncoder()
>>> list(le.classes_)
['amsterdam', 'paris', 'tokyo']
>>> le.transform(["tokyo", "tokyo", "paris"])
array([2, 2, 1]...)
>>> list(le.inverse_transform([2, 2, 1]))
['tokyo', 'tokyo', 'paris']
7.1. 实例
下面,我们基于 sklearn.preprocessing.LabelEncoder 来对样本进行序列化工作:
# -*- coding: UTF-8 -*-
# {{{
import pandas
from sklearn.preprocessing import LabelEncoder
from sklearn.tree import DecisionTreeClassifier


def createDataSet():
    """
    创建数据集

    :return: 数据集与特征集
    """
    dataSet = [['hot', 'sunny', 'high', 'false', 'no'],
               ['hot', 'sunny', 'high', 'true', 'no'],
               ['hot', 'overcast', 'high', 'false', 'yes'],
               ['cool', 'rain', 'normal', 'false', 'yes'],
               ['cool', 'overcast', 'normal', 'true', 'yes'],
               ['mild', 'sunny', 'high', 'false', 'no'],
               ['cool', 'sunny', 'normal', 'false', 'yes'],
               ['mild', 'rain', 'normal', 'false', 'yes'],
               ['mild', 'sunny', 'normal', 'true', 'yes'],
               ['mild', 'overcast', 'high', 'true', 'yes'],
               ['hot', 'overcast', 'normal', 'false', 'yes'],
               ['mild', 'sunny', 'high', 'true', 'no'],
               ['cool', 'sunny', 'normal', 'true', 'no'],
               ['mild', 'sunny', 'high', 'false', 'yes']]
    labels = ['气候', '天气', '气温', '寒冷']
    return dataSet, labels


if __name__ == '__main__':
    dataSet, labels = createDataSet()
    yDataList = []
    for each in dataSet:
        yDataList.append(each[-1])

    dataDict = {}
    for each_label in labels:
        tempList = list()
        for each in dataSet:
            tempList.append(each[labels.index(each_label)])
        dataDict[each_label] = tempList

    dataPD = pandas.DataFrame(dataDict)

    leDict = dict()
    for col in dataPD.columns:
        leDict[col] = LabelEncoder()
        dataPD[col] = leDict[col].fit_transform(dataPD[col])

    dt = DecisionTreeClassifier()
    dt.fit(dataPD.values.tolist(), yDataList)

    xTest = [['hot', 'overcast', 'high', 'false'], ['mild', 'sunny', 'high', 'true']]
    testDict = {}
    for each_label in labels:
        tempList = list()
        for each in xTest:
            tempList.append(each[labels.index(each_label)])
        testDict[each_label] = tempList
    testPD = pandas.DataFrame(testDict)  # 生成pandas.DataFrame
    for col in testPD.columns:  # 为每一列序列化
        testPD[col] = leDict[col].transform(testPD[col])

    result = dt.predict(testPD.values.tolist())
    print(result)
# }}}
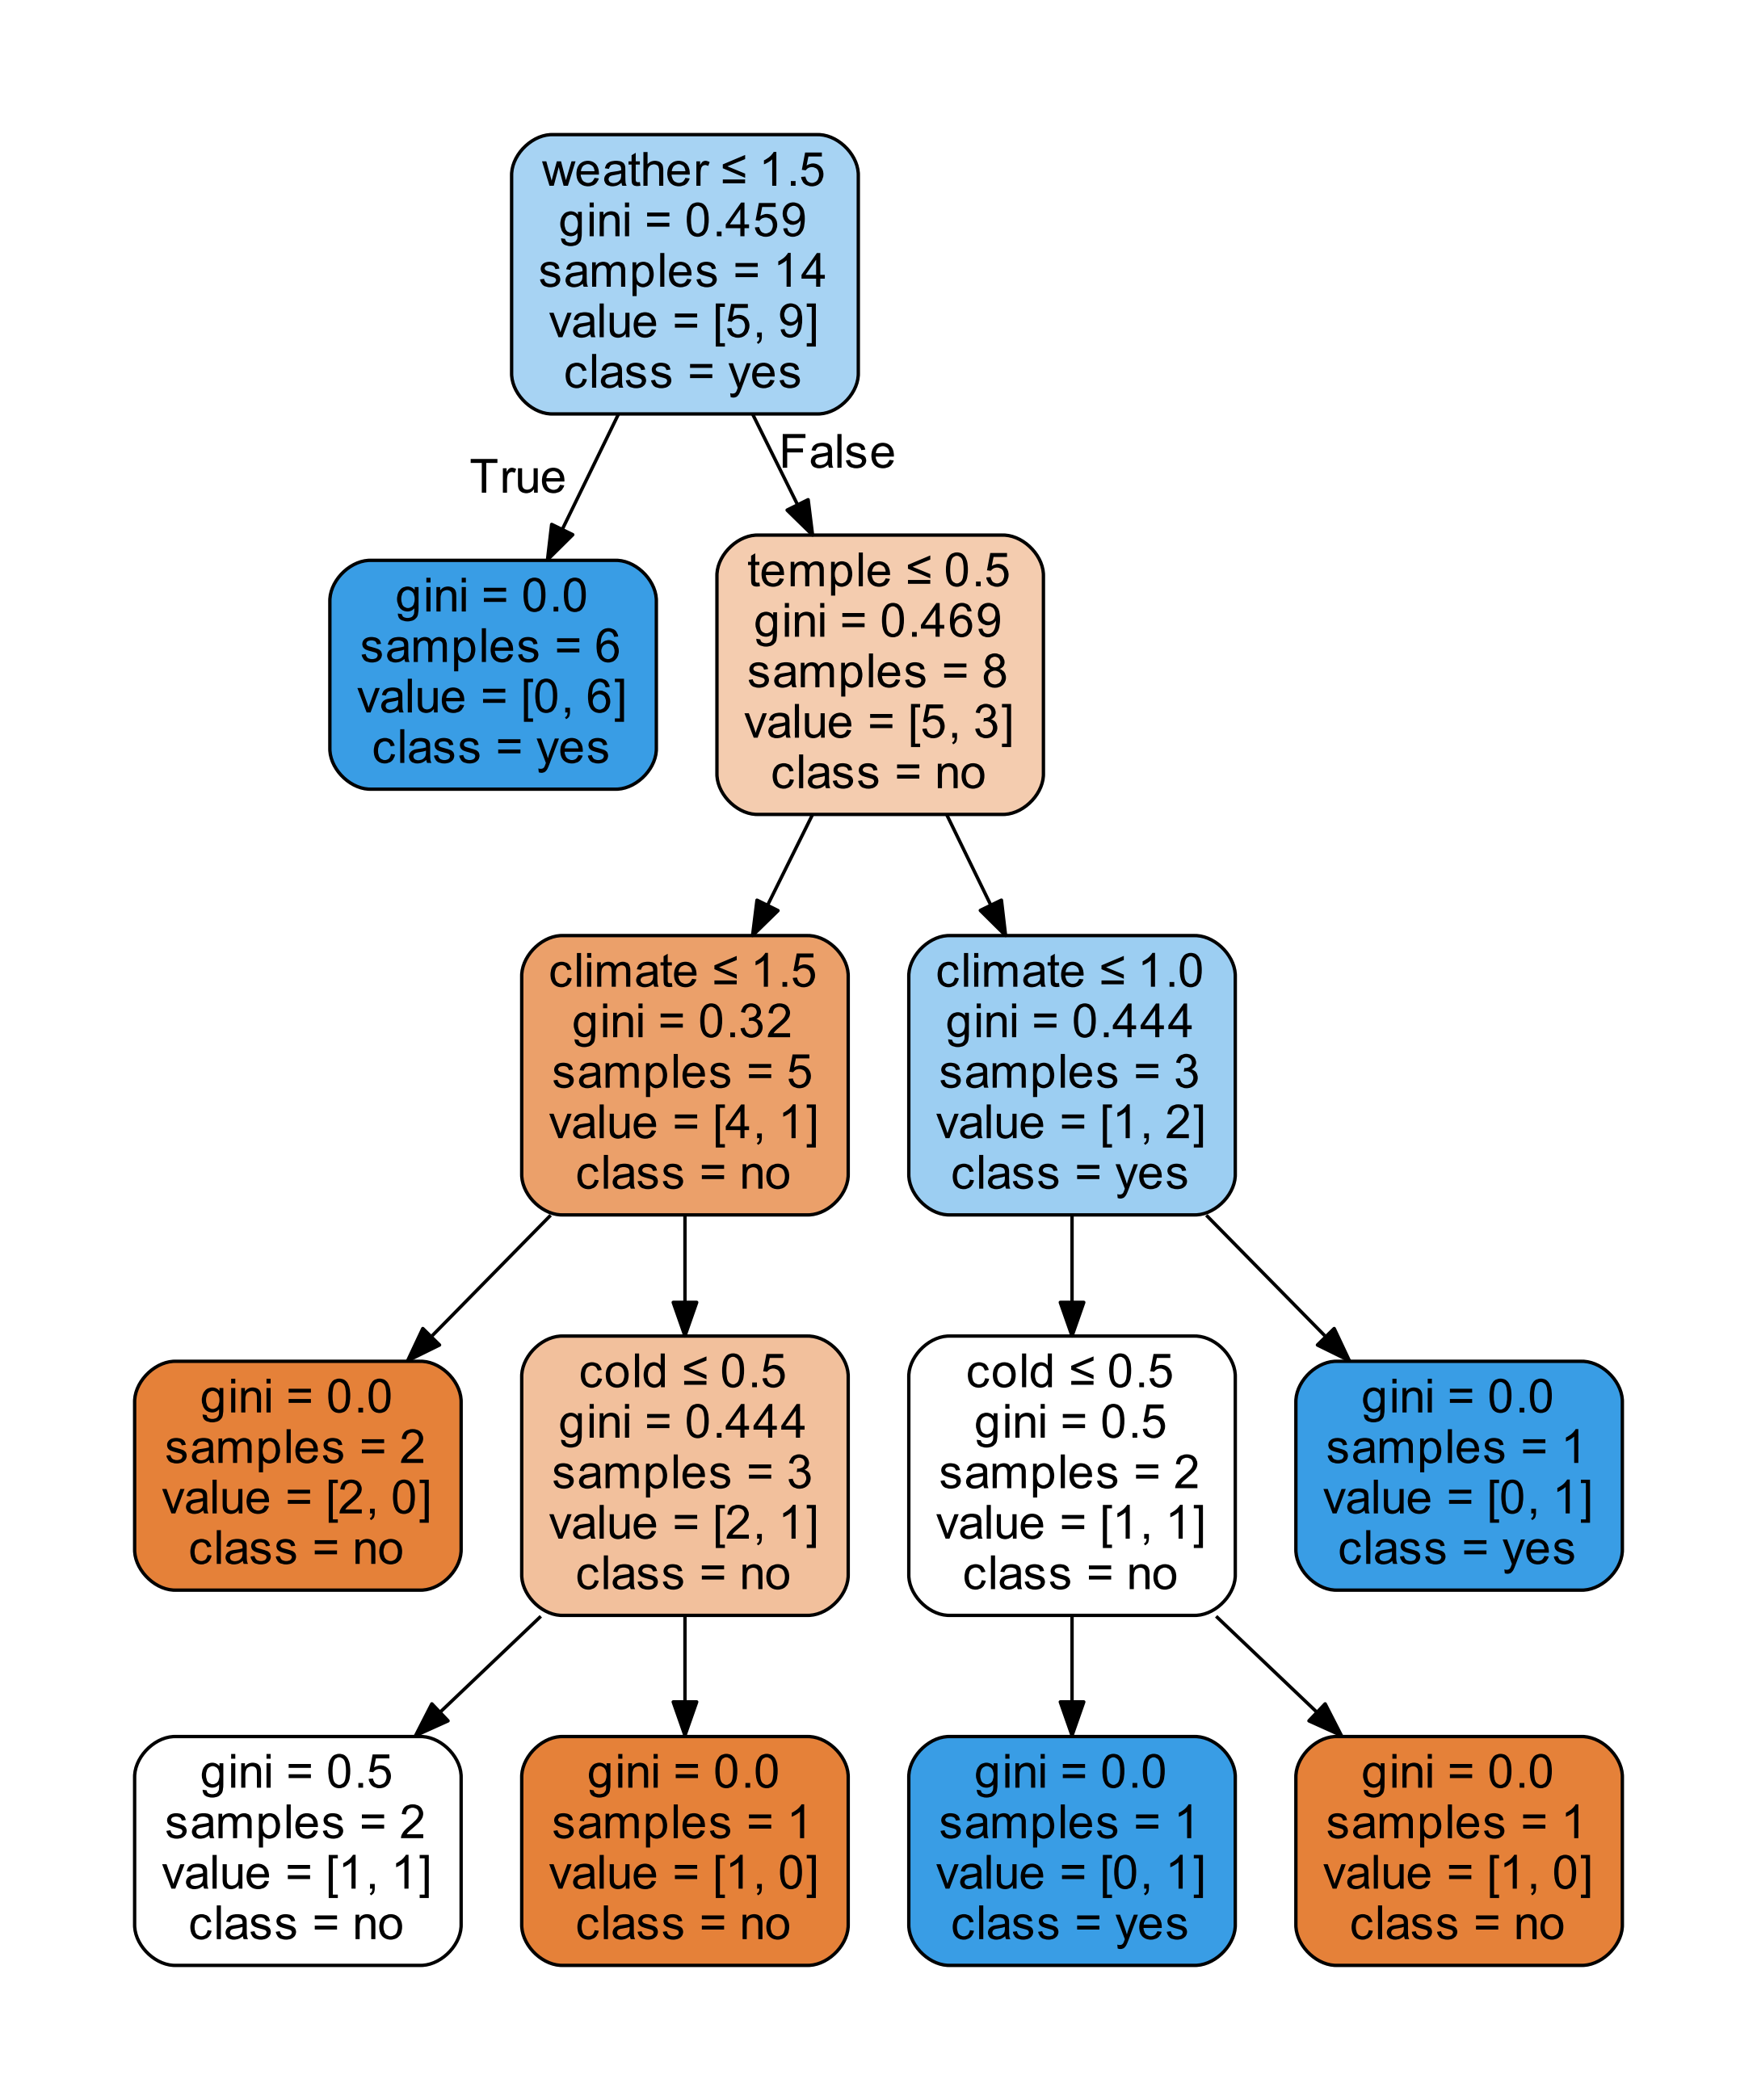
8. 绘制树结构 – Graphviz
决策树最大的优点是我们可以查看最终的树结构,上一篇日志中,我们通过 matplotlib 展示了我们自己的树结构。
但是 matplotlib 绘制树结构较为复杂,我们这里来了解一个更为易用的绘图工具 – Graphviz。
Graphviz 不能通过 pip 直接安装,需要我们手动在官网下载并安装:
https://graphviz.gitlab.io/about/
安装完成以后,需要在环境变量 Graphviz 的 bin 路径。
然后,我们需要安装 pydotplus,你也可以选择安装 pydot,这里我们以 pydotplus 为例,使用 pydot 可以在网上找到示例代码。
pip install pydotplus
然后我们编写代码:
# -*- coding: utf-8 -*-
# {{{
from io import StringIO
import pandas
import pydotplus
from sklearn import tree
from sklearn.preprocessing import LabelEncoder
from sklearn.tree import DecisionTreeClassifier


def createDataSet():
    """
    创建数据集

    :return: 数据集与特征集
    """
    dataSet = [['hot', 'sunny', 'high', 'false', 'no'],
               ['hot', 'sunny', 'high', 'true', 'no'],
               ['hot', 'overcast', 'high', 'false', 'yes'],
               ['cool', 'rain', 'normal', 'false', 'yes'],
               ['cool', 'overcast', 'normal', 'true', 'yes'],
               ['mild', 'sunny', 'high', 'false', 'no'],
               ['cool', 'sunny', 'normal', 'false', 'yes'],
               ['mild', 'rain', 'normal', 'false', 'yes'],
               ['mild', 'sunny', 'normal', 'true', 'yes'],
               ['mild', 'overcast', 'high', 'true', 'yes'],
               ['hot', 'overcast', 'normal', 'false', 'yes'],
               ['mild', 'sunny', 'high', 'true', 'no'],
               ['cool', 'sunny', 'normal', 'true', 'no'],
               ['mild', 'sunny', 'high', 'false', 'yes']]
    labels = ['climate', 'weather', 'temple', 'cold']
    return dataSet, labels


if __name__ == '__main__':
    dataSet, labels = createDataSet()
    yDataList = []  # 提取每组数据的类别,保存在列表里
    for each in dataSet:
        yDataList.append(each[-1])

    dataDict = {}
    for each_label in labels:
        tempList = list()
        for each in dataSet:
            tempList.append(each[labels.index(each_label)])
        dataDict[each_label] = tempList

    dataPD = pandas.DataFrame(dataDict)

    leDict = dict()
    for col in dataPD.columns:
        leDict[col] = LabelEncoder()
        dataPD[col] = leDict[col].fit_transform(dataPD[col])

    dt = DecisionTreeClassifier()
    dt.fit(dataPD.values.tolist(), yDataList)

    dot_data = StringIO()
    tree.export_graphviz(dt, out_file=dot_data,  # 绘制决策树
                         feature_names=dataPD.keys(),
                         class_names=dt.classes_,
                         filled=True, rounded=True,
                         special_characters=True)
    graph = pydotplus.graph_from_dot_data(dot_data.getvalue())
    graph.progs = {'dot': u"C:\\Program Files (x86)\\Graphviz2.38\\bin\\dot.exe"}
    graph.write_pdf("tree.pdf")

    xTest = [['hot', 'overcast', 'high', 'false'], ['mild', 'sunny', 'high', 'true']]
    testDict = {}
    for each_label in labels:
        tempList = list()
        for each in xTest:
            tempList.append(each[labels.index(each_label)])
        testDict[each_label] = tempList
    testPD = pandas.DataFrame(testDict)  # 生成pandas.DataFrame
    for col in testPD.columns:  # 为每一列序列化
        testPD[col] = leDict[col].transform(testPD[col])

    result = dt.predict(testPD.values.tolist())
    print(result)
#}}}
保存图片的部分其实只需要下面几行:
dot_data = StringIO()
tree.export_graphviz(dt, out_file=dot_data,  # 绘制决策树
		     feature_names=dataPD.keys(),
		     class_names=dt.classes_,
		     filled=True, rounded=True,
		     special_characters=True)
graph = pydotplus.graph_from_dot_data(dot_data.getvalue())
graph.write_pdf("tree.pdf")
这样我们就以 PDF 格式保存了图片:
9. InvocationException: GraphViz’s executables not found
开始的时候,遇到了报错:
InvocationException: GraphViz's executables not found
这个问题产生的原因是 pydotplus 没有找到 Graphviz 的执行路径,大部分原因是环境变量的设置问题,也有可能是先安装了 pydotplus 后安装了 Graphviz 造成的。
有一个最简单的解决办法就是手动添加执行路径,正如上文代码中所写:
graph.progs = {'dot': u"C:\\Program Files (x86)\\Graphviz2.38\\bin\\dot.exe"}
欢迎关注微信公众号

参考资料
Peter Harrington 《机器学习实战》。
http://scikit-learn.org/stable/modules/generated/sklearn.tree.DecisionTreeClassifier.html。
http://scikit-learn.org/stable/modules/generated/sklearn.preprocessing.LabelEncoder.html。
https://graphviz.gitlab.io/_pages/Download/Download_windows.html。
https://qiita.com/wm5775/items/1062cc1e96726b153e28。
https://blog.csdn.net/c406495762/article/details/76262487。
https://blog.csdn.net/hujiameihuxu/article/details/79490150。
https://blog.csdn.net/liujingqiu/article/details/77340439。
https://blog.csdn.net/wuchangi/article/details/79589542。