微信小程序自定义时间显示器Demo
废话不多话,还是依旧上图再说,哈哈
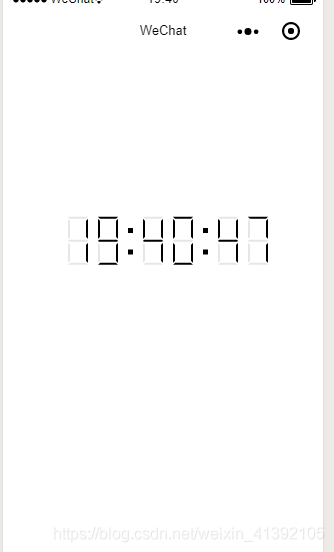
怎么样,效果还是不错的吧,因项目要求,要画出类似于数码管显示的时间样式,没办法,虽然不咋过好弄,但工作毕竟得做,于是乎,楼主,花了3个小时在那里硬生生的算坐标,差不多还是给撸出来,楼主写成了一个插件,方便大家以后使用
具体使用方法很简单
//一如既往的引用方式
var mxDigtial = require('../../utils/mxDigital.js');
 var timeShow = new mxDigtial({
      canvasid: "moneyshow",
      value: "--:--:--",
      width: getApp().globalData.width,
      height: getApp().globalData.height * 0.4,
      size: 20,
      color: "#000"
    })
属性内容我就不介绍了,字面意思很清楚了
目前只提供几个参数的设置一个是重画功能,一个是设置字体粗细,分别为:
  timeShow.setBold(2);				//设置字体粗细
  timeShow.setValue(“1564”);		//设置显示字体,仅支持数码管可显示数字 ,setValue 自带重画
   timeShow. invalidate();			//重画
总体思路
先获取到画布正中心的位置,再次计算字体总长度,字体总长度为每个字体的长度乘以字数加上字数减一乘以字间距,用正中心的位置减去字体总长度的一半就是字体开始绘制的位置,这样子就能保证字体居中显示啦,然后就是在每个字体的位置绘制数码管,就绘制7个数码管,根据不同需求,用不同的颜色来绘制数码管,数码管的数字显示,学硬件的同学都是知道的,废话不多说,上源码:
/**
 * 数据集
 */
var data = {
  pointNumber:0
}
/**
 * wintton
 * 梦辛工作室  灵
 * 2018-11-22
 * @res.canvasid   画布id
 * @res.data.value      要显示的值
 * @res.data.width      画布宽度
 * @res.data.height     画布高度
 * @res.data.size       字体大小
 * @res.data.color      字体颜色
 */
var mxDigital = function drawFont(res) {
    data.ctx = wx.createCanvasContext(res.canvasid);
    data.size = res.size;          //字体大小
    data.color = res.color;        //字体颜色
    data.value = res.value;        //要显示的值
    data.fontSpace = 10;          //字间距
    data.fontoffset = data.size / 8;        //字体宽度
    data.pointsize = data.size / 4;         //小数点字体大小
    data.length = (res.value + "").length;  //字体数
    data.fontGap = 2;              //数码管间隙
    data.fontwidth = 10;   //字宽度
    for (var i = 0;i < data.length;i++){
      var str = data.value.charAt(i);
      if (str == ":" || str == "."){
        data.pointNumber++;
      }
    }
  data.allFontlength = data.length * data.size + (data.length - 1) * data.fontSpace - data.pointNumber * data.size;  //字体总长度
    data.width = res.width;          //宽度
    data.height = res.height;        //高度
   data.pointwidth = 0;        //点的间距

  this.invalidate();
}
function drawPoint(startX, startY) {
  data.ctx.setFillStyle(data.color);
  data.ctx.beginPath();
  data.ctx.moveTo(startX, startY + 2 * data.size);
  data.ctx.lineTo(startX +  data.pointsize, startY + 2 * data.size);
  data.ctx.lineTo(startX +  data.pointsize, startY + 2 * data.size +  data.pointsize);
  data.ctx.lineTo(startX, startY + 2 * data.size +  data.pointsize);
  data.ctx.lineTo(startX, startY + 2 * data.size);
  data.ctx.fill();
}
function drawDoublePoint(startX, startY) {
  data.ctx.setFillStyle(data.color);
  let up = 0.233;
  let down = 0.766;
  data.ctx.beginPath();
  data.ctx.moveTo(startX, startY + 2 * data.size * up);
  data.ctx.lineTo(startX +  data.pointsize, startY + 2 * data.size * up);
  data.ctx.lineTo(startX +  data.pointsize, startY + 2 * data.size * up +  data.pointsize);
  data.ctx.lineTo(startX, startY + 2 * data.size * up +  data.pointsize);
  data.ctx.lineTo(startX, startY + 2 * data.size * up);
  data.ctx.fill();

  data.ctx.beginPath();
  data.ctx.moveTo(startX, startY + 2 * data.size * down);
  data.ctx.lineTo(startX +  data.pointsize, startY + 2 * data.size * down);
  data.ctx.lineTo(startX +  data.pointsize, startY + 2 * data.size * down +  data.pointsize);
  data.ctx.lineTo(startX, startY + 2 * data.size * down +  data.pointsize);
  data.ctx.lineTo(startX, startY + 2 * data.size * down);
  data.ctx.fill();
}
function drawText(datas, startX, startY) {
  var info = [{}, {}, {}, {}, {}, {}, {}];
  //0 从竖线左上第一个开始为0 然后顺时针为 1 - 5, 中间为 6
  info["0"].topLeftX = startX;
  info["0"].topLeftY = startY;
  info["0"].topRightX = startX + data.fontoffset;
  info["0"].topRightY = startY + data.fontoffset;
  info["0"].bottomLeftX = startX;
  info["0"].bottomLeftY = startY + data.size;
  info["0"].bottomRightX = startX + data.fontoffset;
  info["0"].bottomRightY = startY + data.size - data.fontoffset;

  //1
  info["1"].topLeftX = startX;
  info["1"].topLeftY = startY - data.fontGap;
  info["1"].topRightX = startX + data.size;
  info["1"].topRightY = startY - data.fontGap;
  info["1"].bottomLeftX = startX + data.fontoffset;
  info["1"].bottomLeftY = startY + data.fontoffset - data.fontGap;
  info["1"].bottomRightX = startX + data.size - data.fontoffset;
  info["1"].bottomRightY = startY + data.fontoffset - data.fontGap;

  //2
  info["2"].topLeftX = startX + data.size - data.fontoffset;
  info["2"].topLeftY = startY + data.fontoffset;
  info["2"].topRightX = startX + data.size;
  info["2"].topRightY = startY;
  info["2"].bottomLeftX = startX + data.size - data.fontoffset;
  info["2"].bottomLeftY = startY + data.size - data.fontoffset;
  info["2"].bottomRightX = startX + data.size;
  info["2"].bottomRightY = startY + data.size;

  //3
  info["3"].topLeftX = startX + data.size - data.fontoffset;
  info["3"].topLeftY = startY + data.size + 2 * data.fontGap + data.fontoffset;
  info["3"].topRightX = startX + data.size;
  info["3"].topRightY = startY + data.size + 2 * data.fontGap;
  info["3"].bottomLeftX = startX + data.size - data.fontoffset;
  info["3"].bottomLeftY = startY + 2 * data.size + 2 * data.fontGap - data.fontoffset;
  info["3"].bottomRightX = startX + data.size;
  info["3"].bottomRightY = startY + 2 * data.size + 2 * data.fontGap;

  //4
  info["4"].topLeftX = startX + data.fontoffset;
  info["4"].topLeftY = startY + 2 * data.size + 3 * data.fontGap - data.fontoffset;
  info["4"].topRightX = startX + data.size - data.fontoffset;
  info["4"].topRightY = startY + 2 * data.size + 3 * data.fontGap - data.fontoffset;
  info["4"].bottomLeftX = startX;
  info["4"].bottomLeftY = startY + 2 * data.size + 3 * data.fontGap;
  info["4"].bottomRightX = startX + data.size;
  info["4"].bottomRightY = startY + 2 * data.size + 3 * data.fontGap;

  //5
  info["5"].topLeftX = startX;
  info["5"].topLeftY = startY + data.size + 2 * data.fontGap;
  info["5"].topRightX = startX + data.fontoffset;
  info["5"].topRightY = startY + data.size + 2 * data.fontGap + data.fontoffset;
  info["5"].bottomLeftX = startX;
  info["5"].bottomLeftY = startY + 2 * data.size + 2 * data.fontGap;
  info["5"].bottomRightX = startX + data.fontoffset;
  info["5"].bottomRightY = startY + 2 * data.size + 2 * data.fontGap - data.fontoffset;

  //6
  info["6"].topLeftX = startX + data.fontoffset / 2;
  info["6"].topLeftY = startY + data.size - data.fontoffset / 2 + data.fontGap;
  info["6"].topRightX = startX + data.size - data.fontoffset / 2;
  info["6"].topRightY = startY + data.size - data.fontoffset / 2 + data.fontGap;
  info["6"].bottomLeftX = startX + data.fontoffset / 2;
  info["6"].bottomLeftY = startY + data.fontoffset / 2 + data.size + data.fontGap;
  info["6"].bottomRightX = startX + data.size - data.fontoffset / 2;
  info["6"].bottomRightY = startY + data.size + data.fontGap + data.fontoffset / 2;
  info["6"].centerLeftX = startX;
  info["6"].centerLeftY = startY + data.size + data.fontGap;
  info["6"].centerRightX = startX + data.size;
  info["6"].centerRightY = startY + data.size + data.fontGap;

  for (var x in datas) {
    if (datas[x] == "1") {
      data.ctx.setFillStyle(data.color);
    } else {
      data.ctx.setFillStyle("#E6E6E6");
    }

    data.ctx.beginPath();
    if (x == 6) {
      data.ctx.moveTo(info[x].centerLeftX, info[x].centerLeftY);
      data.ctx.lineTo(info[x].topLeftX, info[x].topLeftY);
      data.ctx.lineTo(info[x].topRightX, info[x].topRightY);
      data.ctx.lineTo(info[x].centerRightX, info[x].centerRightY);
      data.ctx.lineTo(info[x].bottomRightX, info[x].bottomRightY);
      data.ctx.lineTo(info[x].bottomLeftX, info[x].bottomLeftY);
      data.ctx.lineTo(info[x].centerLeftX, info[x].centerLeftY);
    } else {
      data.ctx.moveTo(info[x].topLeftX, info[x].topLeftY);
      data.ctx.lineTo(info[x].topRightX, info[x].topRightY);
      data.ctx.lineTo(info[x].bottomRightX, info[x].bottomRightY);
      data.ctx.lineTo(info[x].bottomLeftX, info[x].bottomLeftY);
      data.ctx.lineTo(info[x].topLeftX, info[x].topLeftY);
    }
    data.ctx.fill();
  }
}
mxDigital.prototype.setValue = function (value) {
  data.value = value;
  data.length = (value + "").length
  this.invalidate();
}
mxDigital.prototype.setBold = function (value) {
  data.fontoffset = value;
  this.invalidate();
}
mxDigital.prototype.invalidate = function(){
  data.pointwidth = 0;
  data.pointNumber = 0;
  for (var i = 0; i < data.length; i++) {
    //先计算开始画图的坐标
    var startX = 0;

    if (data.pointwidth == 0) {
      startX = data.width / 2 - data.allFontlength / 2 + (data.size + data.fontSpace) * i + data.pointwidth;
    } else {
      startX = data.width / 2 - data.allFontlength / 2 + (data.size + data.fontSpace) * (i - data.pointNumber) + data.pointwidth;
    }

    var startY = data.height / 2 - data.size;

    let charnumber = (data.value + "").charAt(i);

    switch (charnumber) {
      case "0": {
        drawText(["1", "1", "1", "1", "1", "1", "0"], startX, startY);
      }
        break;
      case "1": {
        drawText(["0", "0", "1", "1", "0", "0", "0"], startX, startY);
      }
        break;
      case "2": {
        drawText(["0", "1", "1", "0", "1", "1", "1"], startX, startY);
      }
        break;
      case "3": {
        drawText(["0", "1", "1", "1", "1", "0", "1"], startX, startY);
      }
        break;
      case "4": {
        drawText(["1", "0", "1", "1", "0", "0", "1"], startX, startY);
      }
        break;
      case "5": {
        drawText(["1", "1", "0", "1", "1", "0", "1"], startX, startY);
      }
        break;
      case "6": {
        drawText(["1", "1", "0", "1", "1", "1", "1"], startX, startY);
      }
        break;
      case "7": {
        drawText(["0", "1", "1", "1", "0", "0", "0"], startX, startY);
      }
        break;
      case "8": {
        drawText(["1", "1", "1", "1", "1", "1", "1"], startX, startY);
      }
        break;
      case "9": {
        drawText(["1", "1", "1", "1", "1", "0", "1"], startX, startY);
      }
        break;
      case "-": {
        drawText(["0", "0", "0", "0", "0", "0", "1"], startX, startY);
      }
        break;
      case ".": {
        drawPoint(startX, startY);
        data.pointNumber++;
        data.pointwidth = (data.fontSpace + data.pointsize) * data.pointNumber;
      }
        break;
      case ":": {
        drawDoublePoint(startX, startY);
        data.pointNumber++;
        data.pointwidth = (data.fontSpace + data.pointsize) * data.pointNumber;
      }
        break;
    }
  }
  data.ctx.draw();
}

module.exports = mxDigital;
我已上传到我的github了,觉得可以的兄弟还是给个start,多谢支持,总有天我也会变成超级大佬的,O(∩_∩)O哈哈~