版权声明:本文为博主原创文章,未经博主允许不得转载。 https://blog.csdn.net/mr_muli/article/details/84553512
- 机器学习之多维缩放(MDS)降维
# -*- coding: utf-8 -*-
"""
Created on Mon Nov 26 17:25:11 2018
@author: muli
"""
import numpy as np
import matplotlib.pyplot as plt
from sklearn import datasets,manifold
def load_data():
'''
加载用于降维的数据
:return: 一个元组,依次为训练样本集和样本集的标记
'''
# 使用 scikit-learn 自带的 iris 数据集
iris=datasets.load_iris()
return iris.data,iris.target
def test_MDS(*data):
'''
测试 MDS 的用法
:param data: 可变参数。
它是一个元组,这里要求其元素依次为:训练样本集、训练样本的标记
:return: None
'''
X,y=data
print(np.shape(X))
print("***************************")
# 依次考察降维目标为 4维、3维、2维、1维
for n in [4,3,2,1]:
mds=manifold.MDS(n_components=n)
mds.fit(X)
# 不一致的距离的总和
print('stress(n_components=%d) : %s'% (n, str(mds.stress_)))
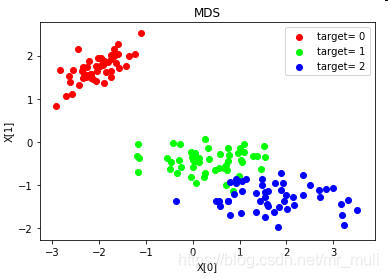
def plot_MDS(*data):
'''
绘制经过 使用 MDS 降维到二维之后的样本点
:param data: 可变参数。
它是一个元组,这里要求其元素依次为:训练样本集、训练样本的标记
:return: None
'''
X,y=data
print(X)
print("------------------------")
mds=manifold.MDS(n_components=2)
#原始数据集转换到二维
X_r=mds.fit_transform(X)
# 查看降维后的数据
print(X_r)
### 绘制二维图形
fig=plt.figure()
ax=fig.add_subplot(1,1,1)
# 颜色集合,不同标记的样本染不同的颜色
colors=((1,0,0),(0,1,0),(0,0,1),(0.5,0.5,0),(0,0.5,0.5),(0.5,0,0.5),
(0.4,0.6,0),(0.6,0.4,0),(0,0.6,0.4),(0.5,0.3,0.2),)
for label ,color in zip( np.unique(y),colors):
position=y==label
ax.scatter(X_r[position,0],X_r[position,1],label="target= %d"%label,color=color)
ax.set_xlabel("X[0]")
ax.set_ylabel("X[1]")
ax.legend(loc="best")
ax.set_title("MDS")
plt.show()
if __name__=='__main__':
X,y=load_data() # 产生用于降维的数据集
test_MDS(X,y) # 调用 test_MDS
# plot_MDS(X,y) # 调用 plot_MDS
- 降维后图: