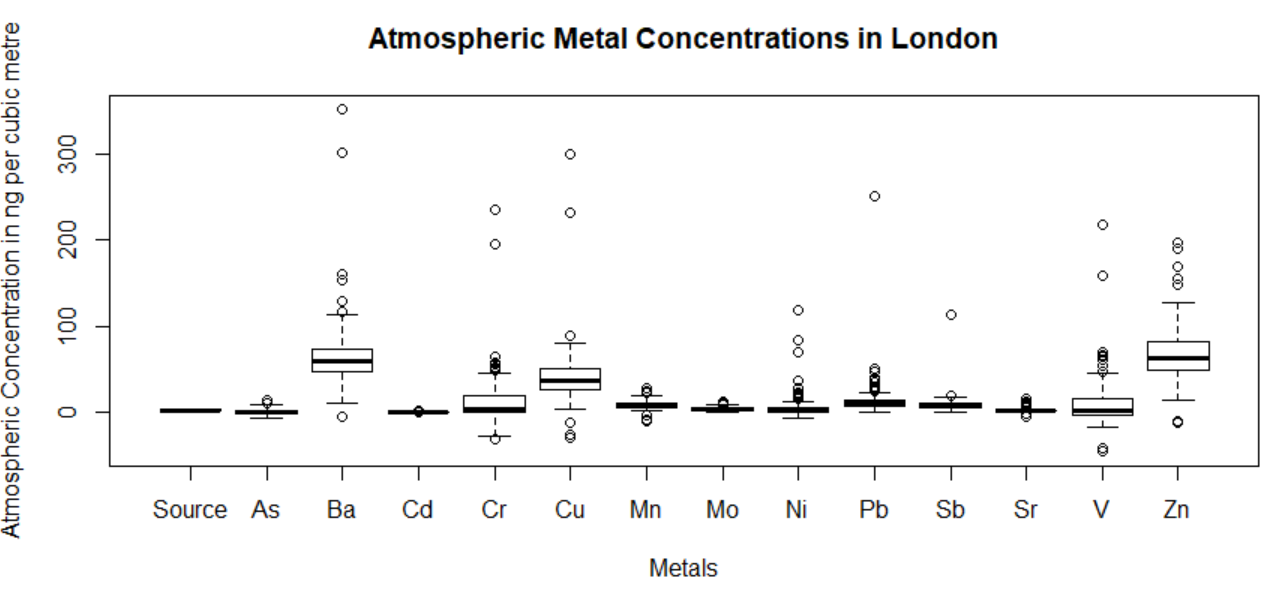
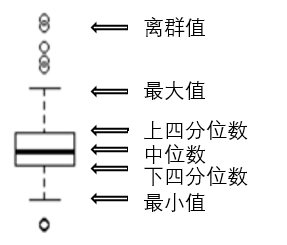
1.箱型图
boxplot()函数
> metals<-read.csv("metals.csv",header=TRUE)                  #读取文件和列名
> boxplot(metals,                                             #数据集
+ xlab="Metals",                                              #设置X轴标题
+ ylab="Atmospheric Concentration in ng per cubic metre",     #设置Y轴标题
+ main="Atmospheric Metal Concentrations in London")          #设置图标题
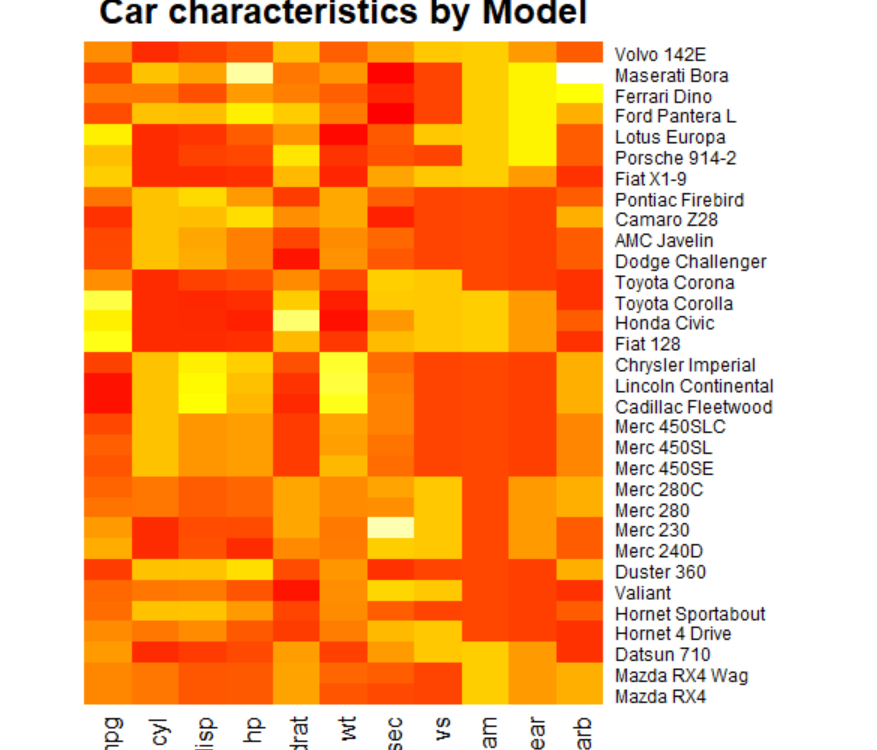
2.热力图
heatmap()函数
> heatmap(as.matrix(mtcars),                   #将自带数据集mtcars转为矩阵
+ Rowv=NA,                                     #不基于行聚类
+ Colv=NA,                                     #不基于列聚类
+ col = heat.colors(256),                      #生成256种颜色
+ scale="column",                              #值集中的方向按列
+ margins=c(2,8),                              #设置页边空白大小
+ main = "Car characteristics by Model")       #设置图标题