0x00 描述
宿主机是 mac mini,构建的项目在 docker 中,所以需要在 PHPStorm 上配置 Xdebug 进行远程代码调试。
0x01 环境
宿主机:macOS High Sierra 10.13.6
Docker:Docker version 18.06.1-ce, build e68fc7a
容器环境:CentOS Linux release 7.5.1804 (Core) + PHP 7.0.32 + nginx/1.12.2 + Xdebug 2.6.1
PhpStorm:2018.2.5
0x03 下载安装 Xdebug
下载 Xdebug
首先要确定 Xdebug 的版本要和环境中的 PHP 版本相对应。
进入 docker 环境,打印 phpinfo() 的输出页面,或者在命令行输入
php -r "phpinfo();"
得到的结果,全选,复制,把结果粘贴到 https://xdebug.org/wizard.php 的文本框中,查看对应的 Xdebug 版本。
安装Xdebug
把得到的 Xdebug 版本下载到 docker 环境中,按照 https://xdebug.org/wizard.php 的说明进行安装:
Download xdebug-2.6.1.tgz
Unpack the downloaded file with tar -xvzf xdebug-2.6.1.tgz
Run: cd xdebug-2.6.1
Run: phpize (See the FAQ if you don't have phpize.

As part of its output it should show:

Configuring for:
...
Zend Module Api No:      20151012
Zend Extension Api No:   320151012
If it does not, you are using the wrong phpize. Please follow this FAQ entry and skip the next step.

Run: ./configure
Run: make
Run: cp modules/xdebug.so /usr/lib64/php/modules
Update /etc/php.ini and change the line
zend_extension = /usr/lib64/php/modules/xdebug.so
0x04 配置 PHP 与 Xdebug
在 docker 中,根据 phpinfo 的 php.ini 路径,打开 php.ini,加入(编辑)以下代码:
[xdebug]
zend_extension=/usr/lib64/php/modules/xdebug.so
xdebug.remote_enable=1
xdebug.remote_handler=dbgp
xdebug.remote_mode=req
xdebug.remote_host=10.203.17.92
xdebug.remote_port=9101
xdebug.idekey=PHPSTORM
xdebug.auto_trace=1
xdebug.auto_exception_trace=1
xdebug.remote_autostart=1
xdebug.collect_vars=1
xdebug.collect_return=1
xdebug.collect_params=1
xdebug.show_local_vars=1
xdebug.profiler_enable=1
xdebug.trace_enable_trigger=1
xdebug.remote_log="/var/log/php.xdebug.log"
有几个地方要注意一下:
1. xdebug.remote_host
这是宿主机的 ip,在 docker 外(mac 环境中),输入命令:
ifconfig
找到 en0 中的 inet:
en0: flags=8863<UP,BROADCAST,SMART,RUNNING,SIMPLEX,MULTICAST> mtu 1500
    options=10b<RXCSUM,TXCSUM,VLAN_HWTAGGING,AV>
    ether 68:fe:f7:0a:81:ff
    inet6 fe80::4f0:bb3b:4a49:d7f9%en0 prefixlen 64 secured scopeid 0x5
    inet 10.203.17.92 netmask 0xffffff00 broadcast 10.203.17.255
    nd6 options=201<PERFORMNUD,DAD>
    media: autoselect (100baseTX <full-duplex>)
    status: active
xdebug.remote_host 就是上面例子中的 10.203.17.92
2. xdebug.remote_port
这里默认是 9000 端口,改一下避免和 php-fpm 的 9000 端口冲突
3. xdebug.remote_log
配置一下,方便排错
另外附上 /etc/php.d/xdebug.ini:
[xdebug]
; repeated defind at /etc/php.d/15-xdebug.ini file
; zend_extension=/usr/lib64/php/modules/xdebug.so
xdebug.remote_enable = on
xdebug.remote_host = 10.203.17.92
xdebug.remote_port = 9101
xdebug.idekey = "PHPSTORM"
这里和 php.ini 保持一致。
0x05 配置 PHPStorm
1. 进入 preferences

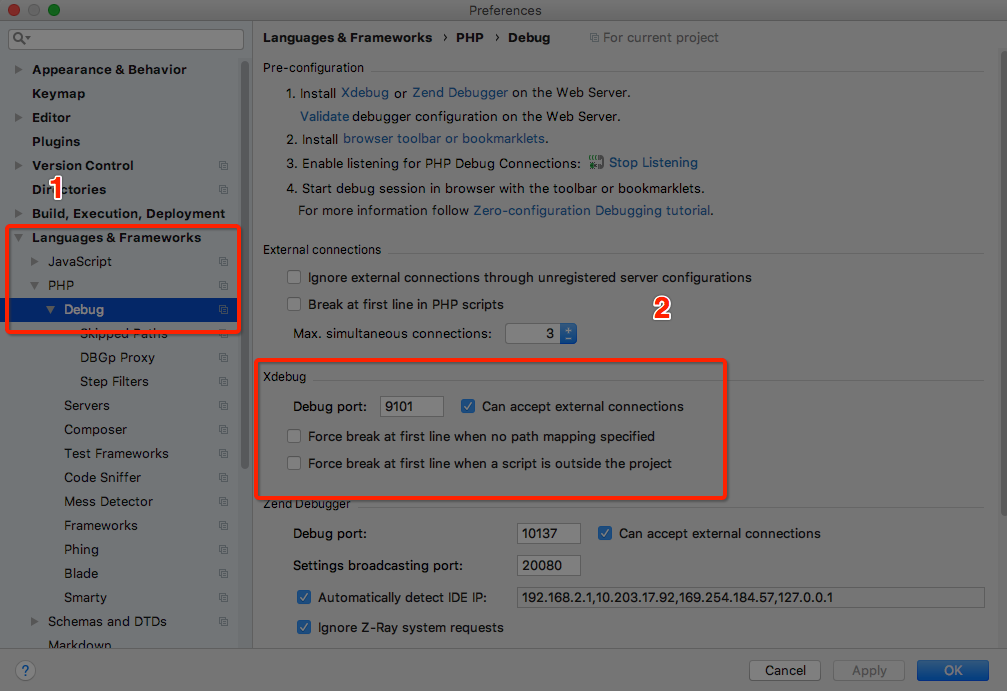
2. 进入 Languages & Frameworks - PHP -Debug ,找到 Xdebug,编辑监听端口和 php.ini 保持一致。
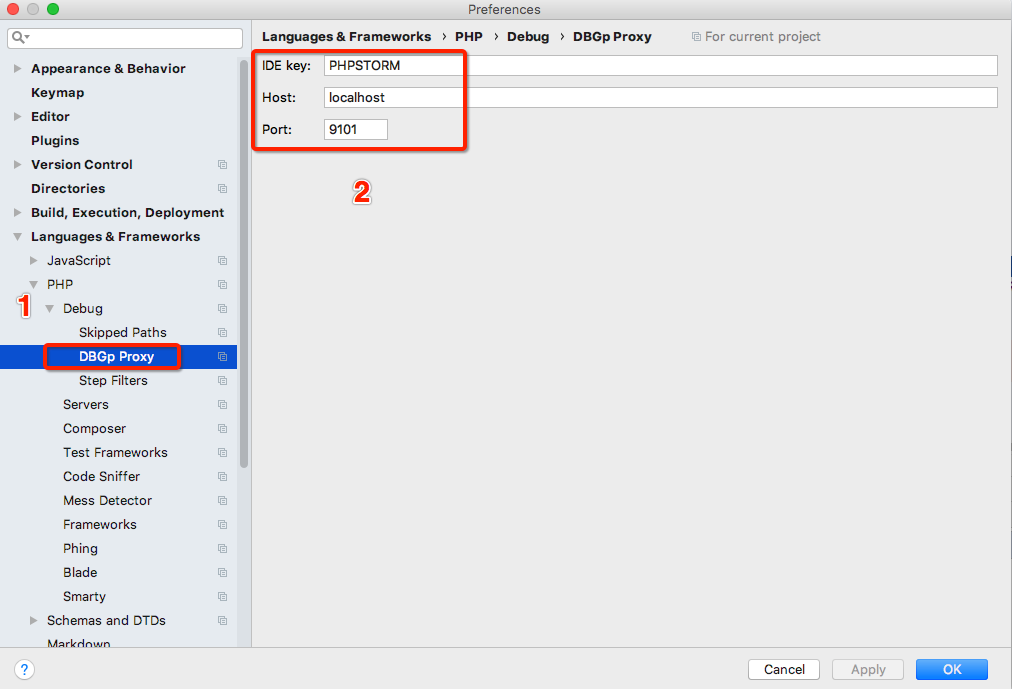
3. 进入 DBGp Proxy,端口和 php.ini 中配置保持一致,配置如下:
4. 进入 Servers,点 “+” 添加一个测试项目,例子中是 admin,Name 随便填写,Host 写项目的域名,端口 80,Debugger 选 Xdebug,勾选下面的路径映射,在右侧填写与本地项目对应的远程目录
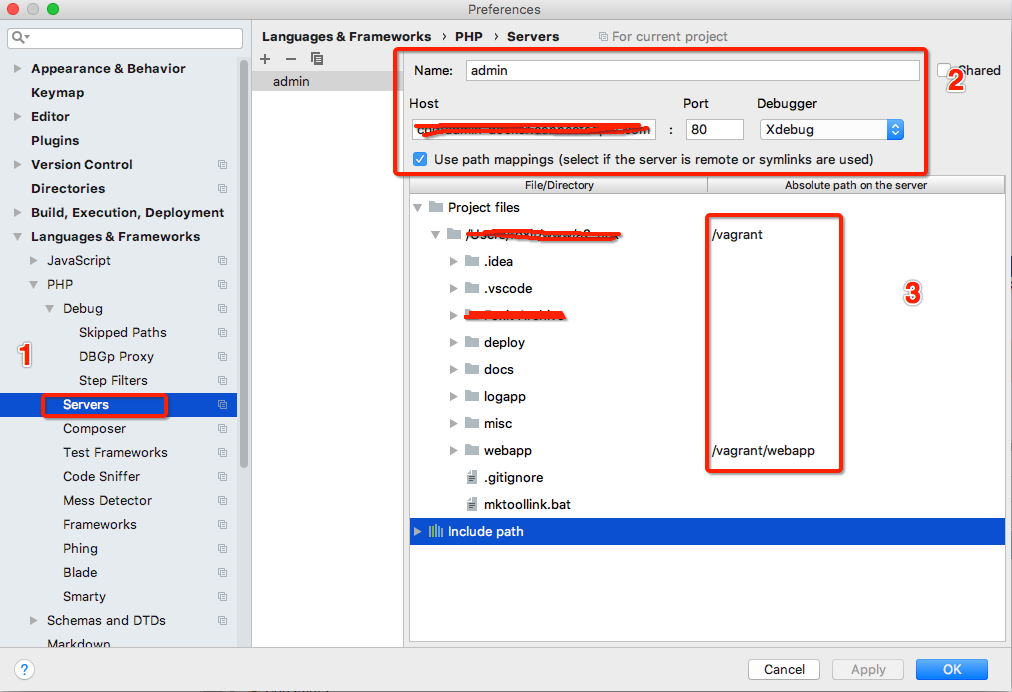
5. 保存。
6. 编辑配置,选择 Edit Configurations
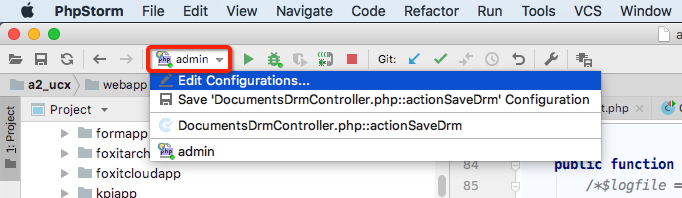
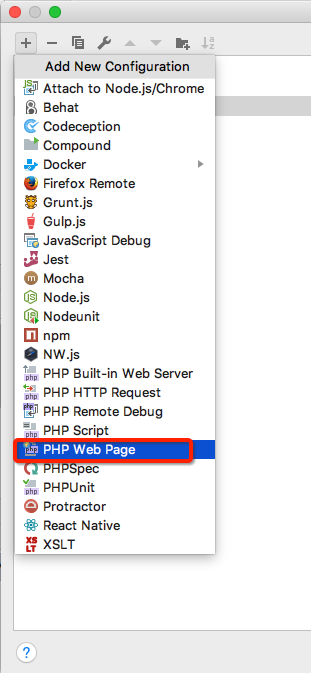
添加一个 PHP Web Page,有的版本是 PHP Web Application,是一样的:
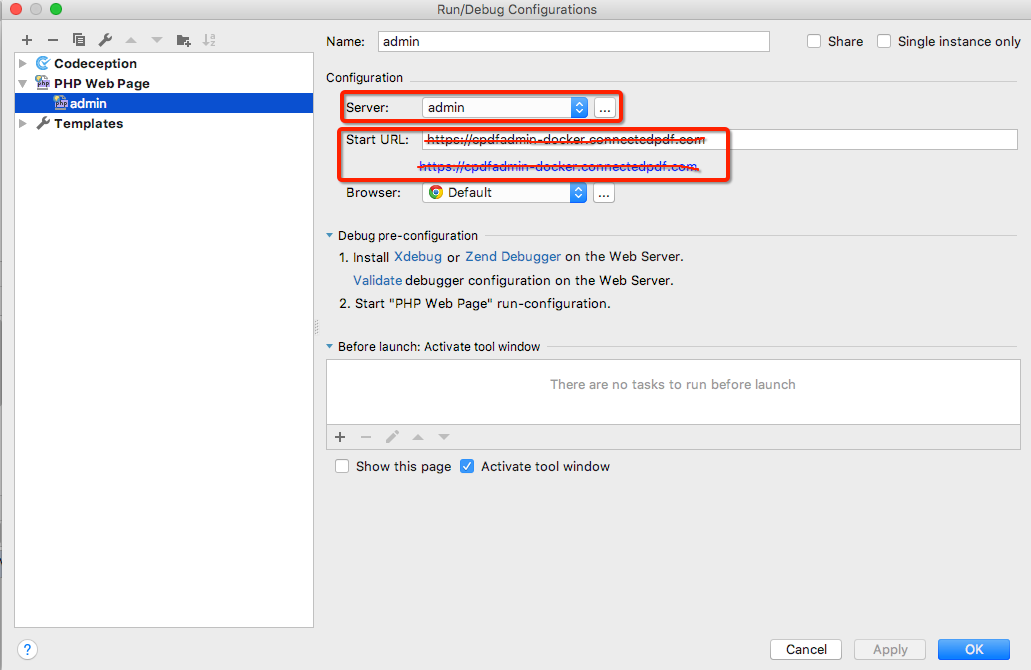
填写配置信息:
Server 选择上两步在 Servers 中添加的 Server,这里是 admin,另外 Start URL 选择项目的首页,即使是 https 的 URL,在上述配置端口的地方一样配置成 80:
7. 保存。
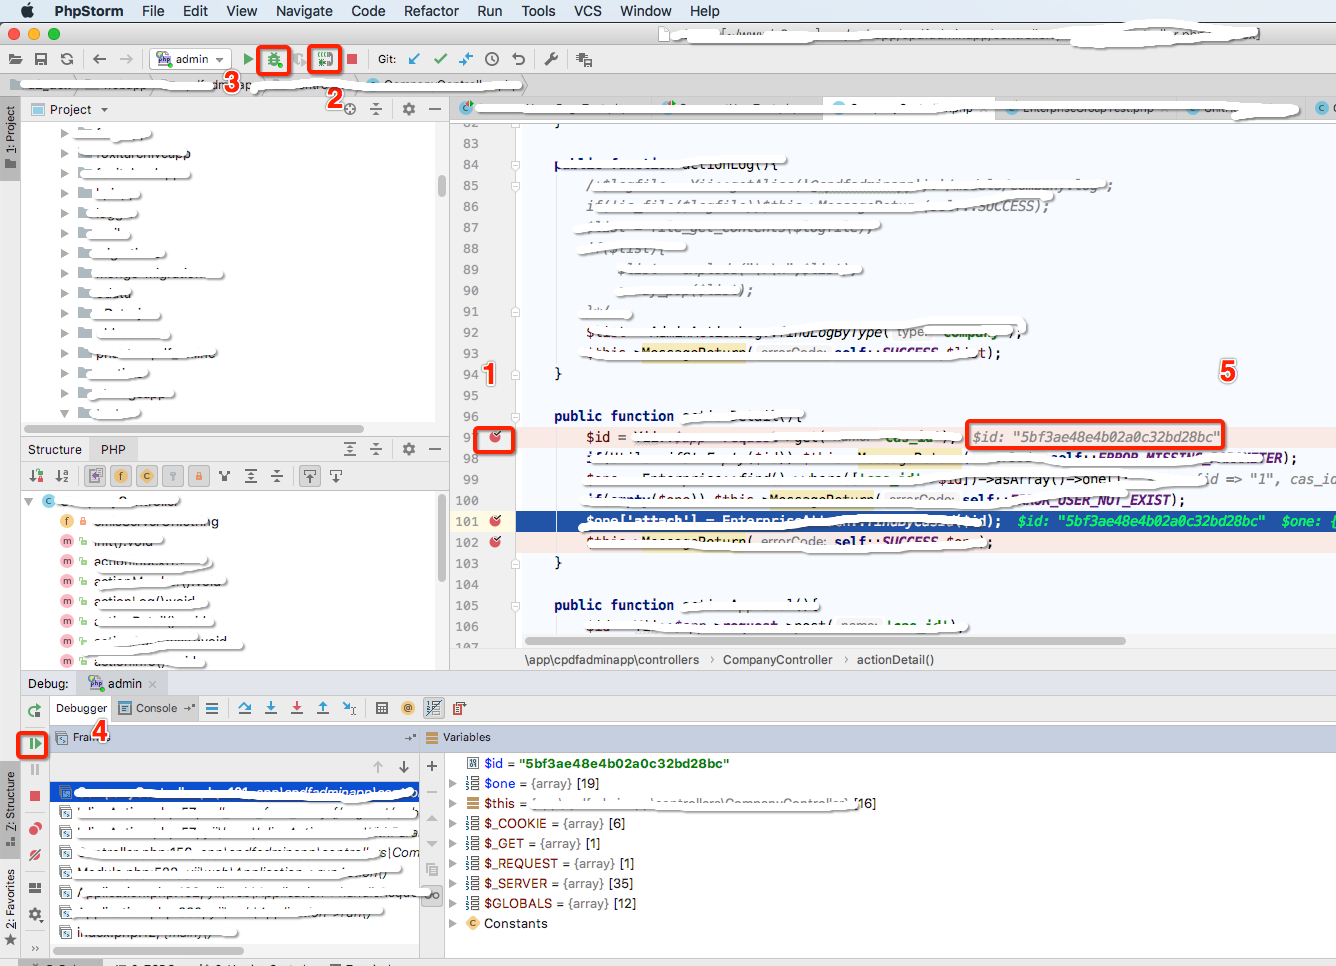
8. 调试:
在代码中设置断点(“1”处),打开“2” 处的电话图标,点击“3”处的 debug 选项,会自动跳到浏览器中之前设置的项目首页,当触发到断点时会自动跳到 PHPStorm 中,“4”处可以跳过断点,“5”处显示变量的值:
0x06 安装浏览器 Xdebug 插件
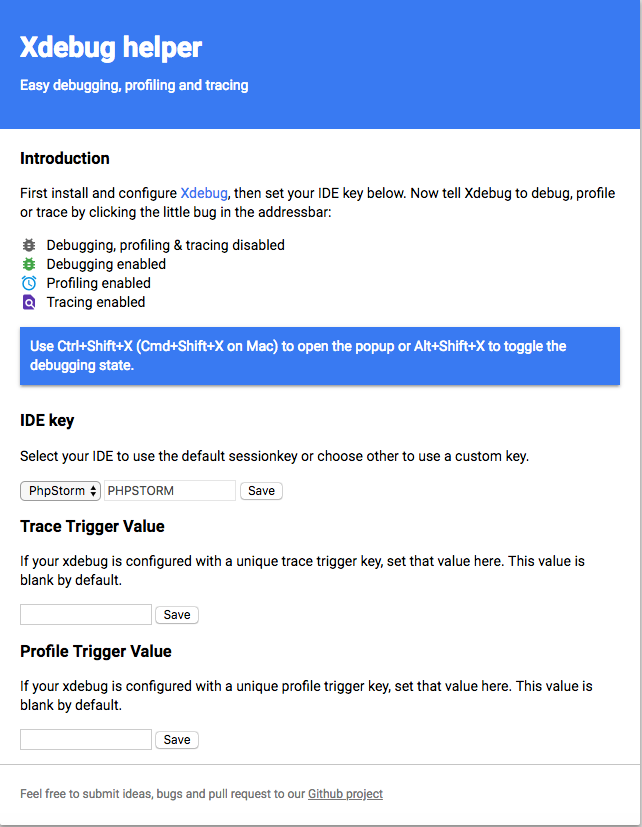
在 google 商店中找到并安装 Xdebug helper,安装之后可以在任意页面启动调试:

以下是 Xdebug helper 的设置页面: