直方图目录:
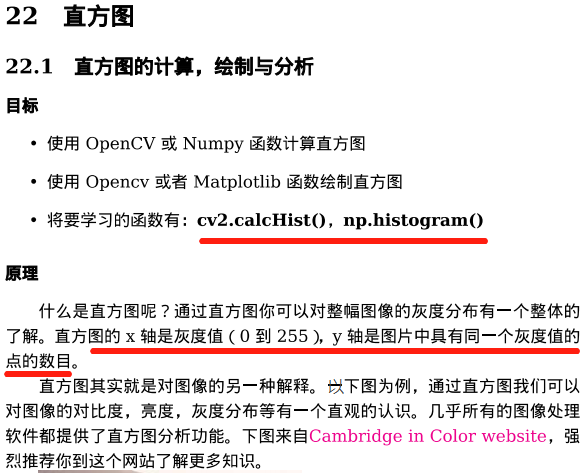
22.1 直方图的计算,绘制与分析
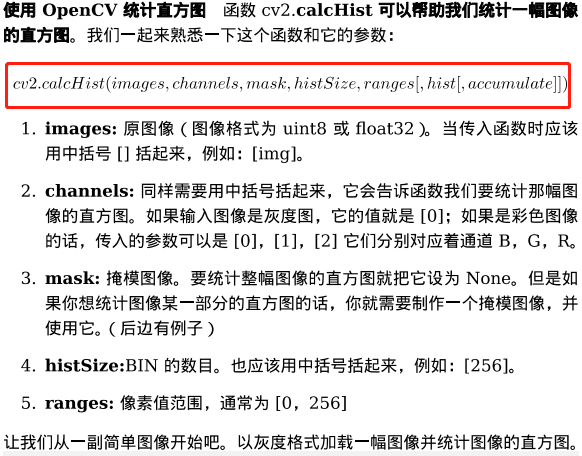
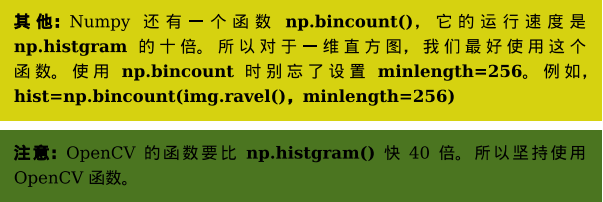
22.1.1 统计直方图
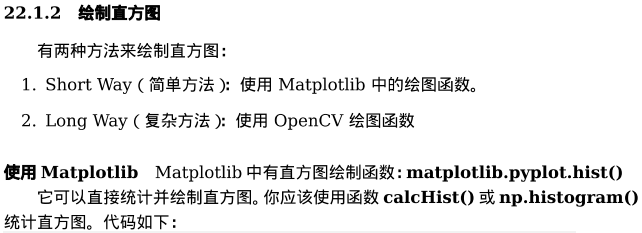
22.1.2 绘制直方图
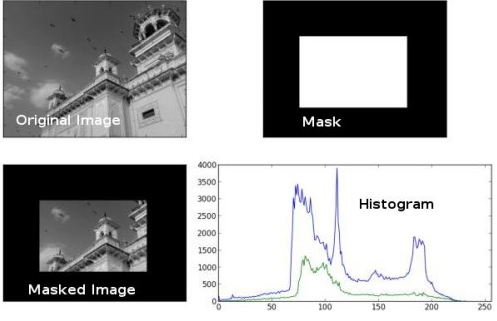
22.1.3 使用掩膜(遮罩)
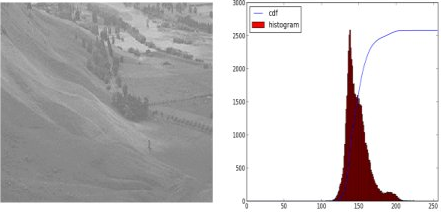
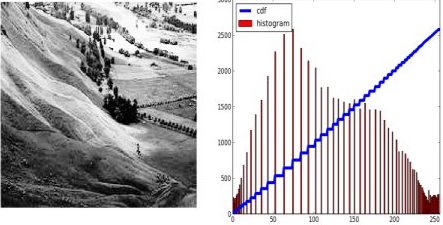
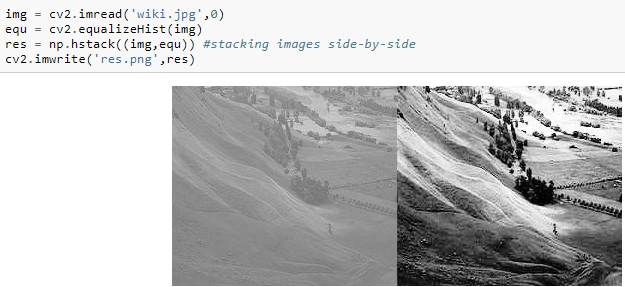
22.2 直方图均衡化
22.2.1 OpenCV中的直方图均衡化
22.2.2 Clahe有限对比适应性直方图
22.3 2D直方图
22.3.1 2D直方图的介绍
22.3.2 OpenCV中的2D直方图
22.3.3 Numpy中的2D直方图
22.3.4 绘制2D直方图
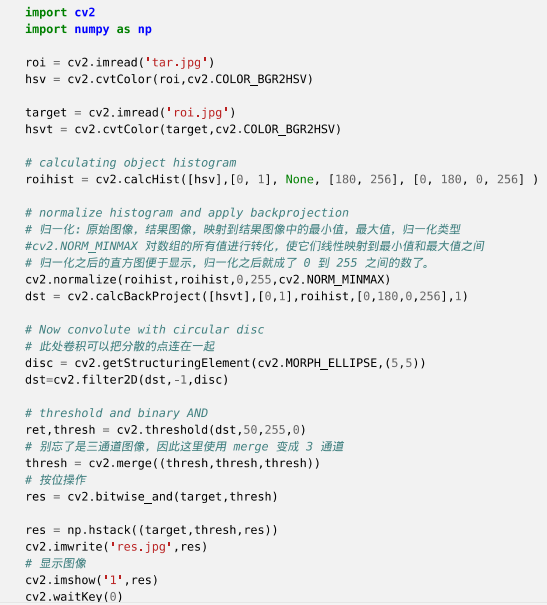
22.4 直方图的反向投影
22.4.1 Numpy 中的算法
22.4.2 OpenCV中的反向投影


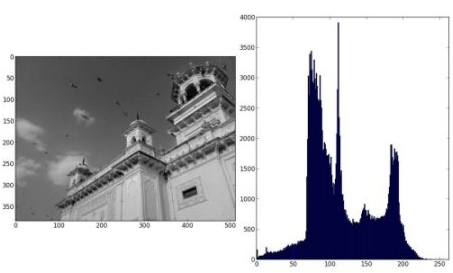
hist 是一个256X1 的数组,每一个值代表了图片中与之对应灰度值的像素点数目


import cv2
import numpy as np
from matplotlib import pyplot as plt

img = cv2.imread('home.jpg',0)
plt.hist(img.ravel(),256,[0,256]); plt.show()
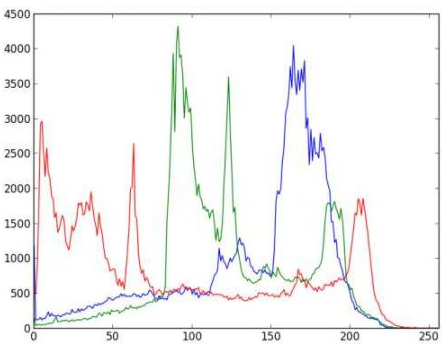
import cv2
import numpy as np
from matplotlib import pyplot as plt

img = cv2.imread('home.jpg')
color = ('b','g','r')
for i,col in enumerate(color):
    histr = cv2.calcHist([img],[i],None,[256],[0,256])
    plt.plot(histr,color = col)
    plt.xlim([0,256])
plt.show()


img = cv2.imread('home.jpg',0)

# create a mask
mask = np.zeros(img.shape[:2], np.uint8)
mask[100:300, 100:400] = 255
masked_img = cv2.bitwise_and(img,img,mask = mask)

# Calculate histogram with mask and without mask
# Check third argument for mask
hist_full = cv2.calcHist([img],[0],None,[256],[0,256])
hist_mask = cv2.calcHist([img],[0],mask,[256],[0,256])

plt.subplot(221), plt.imshow(img, 'gray')
plt.subplot(222), plt.imshow(mask,'gray')
plt.subplot(223), plt.imshow(masked_img, 'gray')
plt.subplot(224), plt.plot(hist_full), plt.plot(hist_mask)
plt.xlim([0,256])

plt.show()
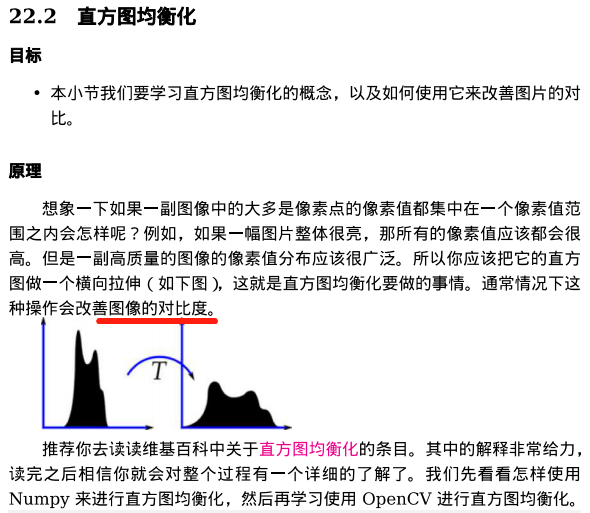
应用:改善图像对比度


参考: