来自流沙公众号
认识:
1、理论:差分离散,较为基础
2、第一次接触matplotlib中ion()和ioff()。ion()开启了交互模式,ioff() 感觉像暂停图像
同时,查阅其他博客得到:
python可视化库matplotlib有两种显示模式:
阻塞(block)模式
交互(interactive)模式
在Python Consol命令行中,默认是交互模式。而在python脚本中,matplotlib默认是阻塞模式。
3、第一次接触pause(time)
4、%.4f s"% (n*dt) 的用法
5、动态打印,每次打印完用cla().
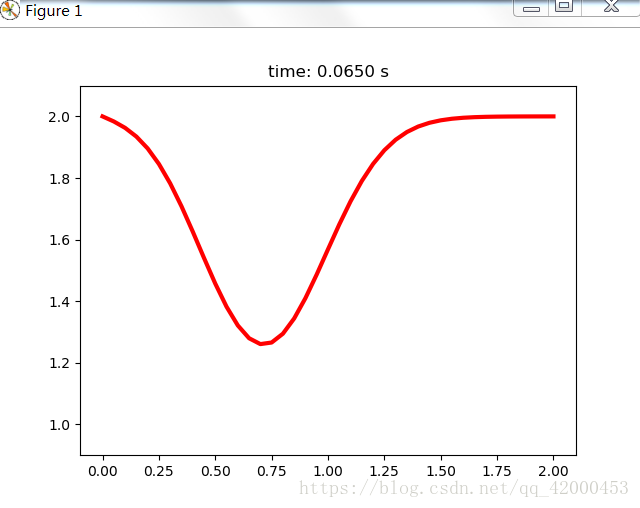
import numpy as np
import matplotlib.pyplot as plt

nx = 41 # 网格节点数
dx = 2 / (nx - 1)  # 网格尺寸
nt = 40 # 时间步长
nu = 0.3 # 扩散系数
sigma = 0.2 # 定义中间变量,用于确定时间步长dt
dt = dx**2 * sigma / nu

# 初始条件
u = 2 * np.ones(nx)
u[int(0.5/dx):int(1/dx)] = 1
un = np.ones(nx)
plt.ion() # 开启了交互模式,打开交互模式 ,同时打开两个窗口显示图片
plt.show()
for n in range(nt):
	plt.cla()   # 清空
	un = u.copy()
	for i in range(1,nx-1):
		u[i] = un[i] + dt * nu / dx**2 * (un[i+1] - 2 * un[i] + u[i-1])
		#绘制图形
	plt.plot(np.linspace(0,2,nx),u,'r',linewidth=3)
	plt.ylim(0.9,2.1)    # 确定y上下轴
	plt.title("time: %.4f s"% (n*dt)) # 将时间打印到图形
	plt.pause(0.2)  # 控制图形显示时间
plt.ioff()      #没有使用ioff()关闭的话,则图像会一闪而过,并不会常留。要想防止这种情况,需要在plt.show()之前加上ioff()命令。
plt.show()
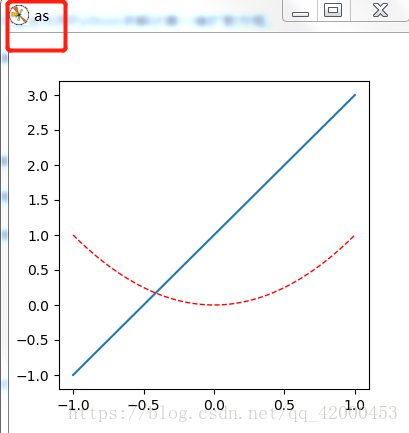
其中查询资料的过程遇到figure,故简单记录一下figure用法
plt.figure(num = “as”, figsize = (4, 4)) # num 若是数字则figure 数字;若是字母则为名字
import numpy as np
import matplotlib.pyplot as plt
x = np.linspace(-1, 1, 50)
y1 = 2 * x + 1
y2 = x**2
plt.figure(num = "as", figsize = (4, 4))   # num 若是数字则figure 数字;若是字母则为名字
plt.plot(x, y1)
plt.plot(x, y2, color = 'red', linewidth = 1.0, linestyle = '--')
plt.show()
本文纯粹是记录学习过程所用。