subplot指令
将图像窗口分成若干个区域,在每个区域内分别绘图.
handle = subplot(m, n, p);
上述指令将图像划分为 m*n 个子区域, p用于指向子区域. 顺序为
1 2 3 … n
n+1 n+2 n+3 2n
……………………………………..
(m-1)n+1 ……………………m*n
例子:
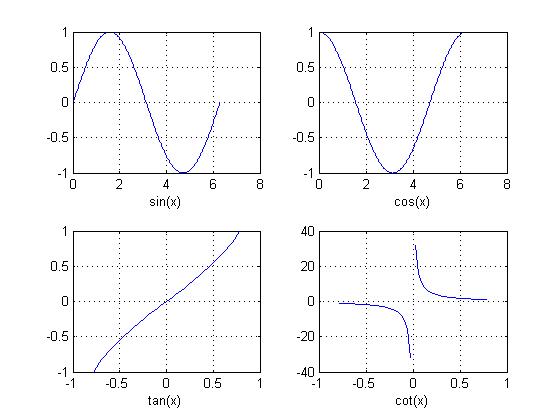
x = 0 : pi / 100: 2 * pi;
y = sin(x);
subplot(2, 2, 1), plot(x, y)
xlabel('sin(x)');
grid on

y = cos(x);
subplot(2, 2, 2), plot(x, y)
xlabel('cos(x)');
grid on

clear
x = -pi/4 : pi / 100: +pi/4;
y = tan(x);
subplot(2, 2, 3), plot(x, y)
xlabel('tan(x)');
grid on

y = cot(x);
subplot(2, 2, 4), plot(x, y)
xlabel('cot(x)');
grid on
- 1
- 2
- 3
- 4
- 5
- 6
- 7
- 8
- 9
- 10
- 11
- 12
- 13
- 14
- 15
- 16
- 17
- 18
- 19
- 20
- 21
- 22
end
转载自:https://blog.csdn.net/human_recognition/article/details/51824252