版权声明:站在巨人的肩膀上学习。 https://blog.csdn.net/zgcr654321/article/details/83622885
将Numpy数组保存为图像,有以下几种方法:
1、使用scipy.misc
代码如下:
from PIL import Image
import numpy as np
from scipy import misc

# 首先在该py文件所在目录下随便放一张图片,使用PIL.Image库的open方法打开
image = Image.open("0_train.jpg")
# 使用numpy将该图片的二进制数据转换成多维数组形式
image_array = np.array(image)
# 打印该数组
print(image_array)
# 使用misc.imsave方法将数组保存为图片
misc.imsave('out.jpg', image_array)
运行结果如下:
[[[244 244 242]
  [244 244 242]
  [246 245 243]
  ...
  [255 252 249]
  [250 249 245]
  [239 240 235]]

 [[251 250 248]
  [249 248 244]
  [247 246 244]
  ...
  [236 232 229]
  [253 252 248]
  [251 252 247]]

 [[252 248 245]
  [249 246 241]
  [245 241 238]
  ...
  [247 243 240]
  [245 244 240]
  [250 251 246]]

 ...

 [[249 244 241]
  [250 245 242]
  [251 246 243]
  ...
  [251 237 236]
  [242 228 227]
  [255 251 250]]

 [[248 242 242]
  [250 244 244]
  [251 245 245]
  ...
  [249 233 233]
  [250 234 234]
  [255 243 243]]

 [[249 243 243]
  [250 244 244]
  [251 245 245]
  ...
  [255 242 242]
  [255 250 250]
  [249 233 233]]]

Process finished with exit code 0
py文件所在的目录下生成了out.jpg图片,且该图片和0_train.jpg图片相同。

scipy.imsave方法会标准化所有图像,使数组中的最小值min(数据)变成黑色,最大值max(数据)变成白色。
如果数组数据是精确的灰度级或准确的RGB通道的数据,则代码如下:
from PIL import Image
import numpy as np
# 使用PIL库和numpy库只是为了快速得到一个可以用于保存为图片的数组,即从现有的图片直接转换成数组
from scipy import misc

# 首先在该py文件所在目录下随便放一张图片,使用PIL.Image库的open方法打开
image = Image.open("0_train.jpg")
# 使用numpy将该图片的二进制数据转换成多维数组形式
image_array = np.array(image)
# 打印该数组
print(image_array)
# 使用misc.imsave方法将数组保存为图片
misc.toimage(image_array, cmin=0.0, cmax=...).save('outfile.jpg')
运行结果如下:
[[[244 244 242]
  [244 244 242]
  [246 245 243]
  ...
  [255 252 249]
  [250 249 245]
  [239 240 235]]

 [[251 250 248]
  [249 248 244]
  [247 246 244]
  ...
  [236 232 229]
  [253 252 248]
  [251 252 247]]

 [[252 248 245]
  [249 246 241]
  [245 241 238]
  ...
  [247 243 240]
  [245 244 240]
  [250 251 246]]

 ...

 [[249 244 241]
  [250 245 242]
  [251 246 243]
  ...
  [251 237 236]
  [242 228 227]
  [255 251 250]]

 [[248 242 242]
  [250 244 244]
  [251 245 245]
  ...
  [249 233 233]
  [250 234 234]
  [255 243 243]]

 [[249 243 243]
  [250 244 244]
  [251 245 245]
  ...
  [255 242 242]
  [255 250 250]
  [249 233 233]]]

Process finished with exit code 0
py文件所在目录下生成outfile.jpg图片,且该图片和0_train图片一样。

2、使用PIL库
代码如下:
from PIL import Image
import numpy as np

# 打开图片
im = Image.open("0_train.jpg")
# 将图片转化为numpy数组
im_array = np.array(im)
# 打印数组
print(im_array)
# 将数组转化回图片
img = Image.fromarray(im_array).convert('RGB')
# 将数组保存为图片
img.save("out.bmp")
运行结果如下:
[[[244 244 242]
  [244 244 242]
  [246 245 243]
  ...
  [255 252 249]
  [250 249 245]
  [239 240 235]]

 [[251 250 248]
  [249 248 244]
  [247 246 244]
  ...
  [236 232 229]
  [253 252 248]
  [251 252 247]]

 [[252 248 245]
  [249 246 241]
  [245 241 238]
  ...
  [247 243 240]
  [245 244 240]
  [250 251 246]]

 ...

 [[249 244 241]
  [250 245 242]
  [251 246 243]
  ...
  [251 237 236]
  [242 228 227]
  [255 251 250]]

 [[248 242 242]
  [250 244 244]
  [251 245 245]
  ...
  [249 233 233]
  [250 234 234]
  [255 243 243]]

 [[249 243 243]
  [250 244 244]
  [251 245 245]
  ...
  [255 242 242]
  [255 250 250]
  [249 233 233]]]

Process finished with exit code 0
生成的图片如下:

使用PIL库保存图片的最大好处是,你可以将图片保存为目前支持的几乎所有主流图片格式,如jpg,png,bmp等。
3、使用matplotlib的两种方法
代码如下:
from PIL import Image
import numpy as np
# 使用PIL库和numpy是只是为了快速得到一个可以用于保存为图片的数组,即从现有的图片直接转换成数组
from matplotlib import image

# 打开图片
im = Image.open("0_train.jpg")
# 将图片转化为numpy数组
im_array = np.array(im)
# 打印数组
print(im_array)
# 保存图片
image.imsave("out_plt.png", im_array)
运行结果如下:
[[[244 244 242]
  [244 244 242]
  [246 245 243]
  ...
  [255 252 249]
  [250 249 245]
  [239 240 235]]

 [[251 250 248]
  [249 248 244]
  [247 246 244]
  ...
  [236 232 229]
  [253 252 248]
  [251 252 247]]

 [[252 248 245]
  [249 246 241]
  [245 241 238]
  ...
  [247 243 240]
  [245 244 240]
  [250 251 246]]

 ...

 [[249 244 241]
  [250 245 242]
  [251 246 243]
  ...
  [251 237 236]
  [242 228 227]
  [255 251 250]]

 [[248 242 242]
  [250 244 244]
  [251 245 245]
  ...
  [249 233 233]
  [250 234 234]
  [255 243 243]]

 [[249 243 243]
  [250 244 244]
  [251 245 245]
  ...
  [255 242 242]
  [255 250 250]
  [249 233 233]]]

Process finished with exit code 0
生成的图片如图所示。

使用matplotlib还可以用pyplot的绘图功能来用数组的数据绘制出图片再保存。
代码如下:
from PIL import Image
import numpy as np
# 使用PIL库和numpy是只是为了快速得到一个可以用于保存为图片的数组,即从现有的图片直接转换成数组
import matplotlib.pyplot as plt

# 打开图片
im = Image.open("0_train.jpg")
# 将图片转化为numpy数组
im_array = np.array(im)
# 打印数组
print(im_array)
# 绘制图片
plt.imshow(im_array)
# 保存图片
plt.savefig("out_plt2.png")
运行结果如下:
[[[244 244 242]
[244 244 242]
[246 245 243]
...
[255 252 249]
[250 249 245]
[239 240 235]]
[[251 250 248]
[249 248 244]
[247 246 244]
...
[236 232 229]
[253 252 248]
[251 252 247]]
[[252 248 245]
[249 246 241]
[245 241 238]
...
[247 243 240]
[245 244 240]
[250 251 246]]
...
[[249 244 241]
[250 245 242]
[251 246 243]
...
[251 237 236]
[242 228 227]
[255 251 250]]
[[248 242 242]
[250 244 244]
[251 245 245]
...
[249 233 233]
[250 234 234]
[255 243 243]]
[[249 243 243]
[250 244 244]
[251 245 245]
...
[255 242 242]
[255 250 250]
[249 233 233]]]
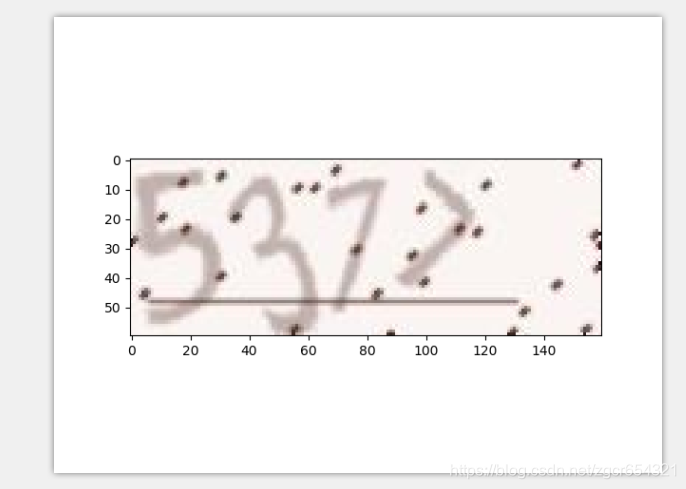
Process finished with exit code 0生成图片如下。注意这种方式生成的图片默认是带坐标轴的。你可以使用pyplot中相关方法隐藏坐标轴。另外这种绘制出的图片四周有空白。
原图:
生成图:
4、使用opencv库
代码如下:
from PIL import Image
import numpy as np
import cv2

# 打开图片
im = Image.open("0_train.jpg")
# 将图片转化为numpy数组
im_array = np.array(im)
# 打印数组
print(im_array)
# 保存图片
cv2.imwrite("out_cv2.jpg", im_array)
运行结果如下:
[[[244 244 242]
  [244 244 242]
  [246 245 243]
  ...
  [255 252 249]
  [250 249 245]
  [239 240 235]]

 [[251 250 248]
  [249 248 244]
  [247 246 244]
  ...
  [236 232 229]
  [253 252 248]
  [251 252 247]]

 [[252 248 245]
  [249 246 241]
  [245 241 238]
  ...
  [247 243 240]
  [245 244 240]
  [250 251 246]]

 ...

 [[249 244 241]
  [250 245 242]
  [251 246 243]
  ...
  [251 237 236]
  [242 228 227]
  [255 251 250]]

 [[248 242 242]
  [250 244 244]
  [251 245 245]
  ...
  [249 233 233]
  [250 234 234]
  [255 243 243]]

 [[249 243 243]
  [250 244 244]
  [251 245 245]
  ...
  [255 242 242]
  [255 250 250]
  [249 233 233]]]

Process finished with exit code 0
生成图片如下:
