版权声明:本文为博主原创文章,未经博主允许不得转载。 https://blog.csdn.net/ZLK961543260/article/details/80454009
本文源码下载地址:https://download.csdn.net/download/zlk961543260/10740481(看到下载评论中说有错误,更新了一个下载地址。如果没有积分的朋友,留个邮箱,我看到后发给你们)
研究了两天chart控件,终于有点眉目了。网上一搜一大堆,开始还是有点蒙的,毕竟这个控件的属性有点多啊。但是这么多属性竟然没有一个适合我的。在我的项目中,数据量上千,那么对于有限的x轴来说应该怎么整,用滚动条来做,但是一时半会还不知道怎么弄。后来偶然间得到一个程序发现跟我的挺契合的,拿来做了修改,今天在博客中给出一个demo供各位参考。
首先来看看做出来的效果图吧!
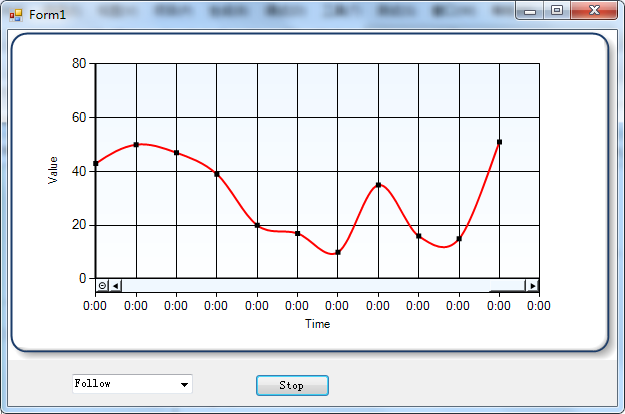
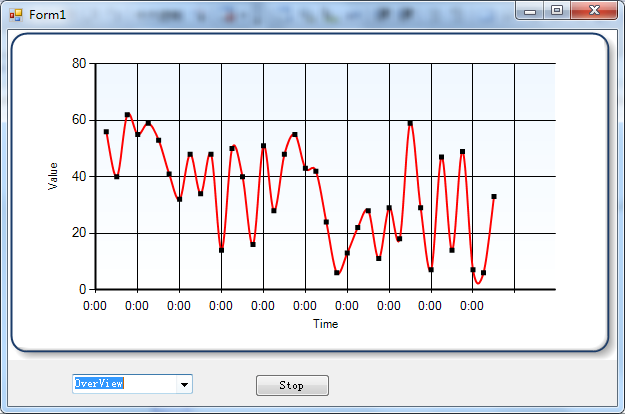
以上是两种效果,一种是全局的,一种是当前的,页面中有一个stop按钮。
一、做到以上效果需要的控件。
1.chart控件 (在本例中name为chart) 2.timer控件(本例中name为t) 3.combobox控件(name为combobox1) 4.button控件(name为button_Stop)
下面是该程序的代码,我就不多做解释了,都是一些属性。这些属性只有自己用一天或者几天才能明白,我在这说半天也是白扯。算了,还是说两句,chart是一个控件,控件中我们要画图,
在什么地方画:chartArea。(这个属性特别的多)
画的是啥呢:Series,,Series里存的是点的坐标,也就是x轴是啥,y轴是啥。(这个属性还好)
代码:
using System;
using System.Collections.Generic;
using System.ComponentModel;
using System.Data;
using System.Drawing;
using System.Linq;
using System.Text;
using System.Windows.Forms;
using System.Windows.Forms.DataVisualization.Charting;

namespace WindowsFormsApplication1
{
    public partial class Form2 : Form
    {
        public Form2()
        {
            InitializeComponent();
        }

        Series series1;
        int sum = 1;
        bool flag = false;
        private void Form2_Load(object sender, EventArgs e)
        {
            createSeries();
            CreateChart();
            t.Start();
        }

        private void CreateChart()
        {
            ChartArea chartArea = new ChartArea();
            chartArea.Name = "FirstArea";

            chartArea.CursorX.IsUserEnabled = true;
            chartArea.CursorX.IsUserSelectionEnabled = true;
            chartArea.CursorX.SelectionColor = Color.SkyBlue;
            chartArea.CursorY.IsUserEnabled = true;
            chartArea.CursorY.AutoScroll = true;
            chartArea.CursorY.IsUserSelectionEnabled = true;
            chartArea.CursorY.SelectionColor = Color.SkyBlue;

            chartArea.CursorX.IntervalType = DateTimeIntervalType.Auto;
            chartArea.AxisX.ScaleView.Zoomable = false;
            chartArea.AxisX.ScrollBar.ButtonStyle = ScrollBarButtonStyles.All;//启用X轴滚动条按钮

            chartArea.BackColor = Color.AliceBlue;                      //背景色
            chartArea.BackSecondaryColor = Color.White;                 //渐变背景色
            chartArea.BackGradientStyle = GradientStyle.TopBottom;      //渐变方式
            chartArea.BackHatchStyle = ChartHatchStyle.None;            //背景阴影
            chartArea.BorderDashStyle = ChartDashStyle.NotSet;          //边框线样式
            chartArea.BorderWidth = 1;                                  //边框宽度
            chartArea.BorderColor = Color.Black;


            chartArea.AxisX.MajorGrid.Enabled = true;
            chartArea.AxisY.MajorGrid.Enabled = true;

            // Axis
            chartArea.AxisY.Title = @"Value";
            chartArea.AxisY.LabelAutoFitMinFontSize = 5;
            chartArea.AxisY.LineWidth = 2;
            chartArea.AxisY.LineColor = Color.Black;
            chartArea.AxisY.Enabled = AxisEnabled.True;

            chartArea.AxisX.Title = @"Time";
            chartArea.AxisX.IsLabelAutoFit = true;
            chartArea.AxisX.LabelAutoFitMinFontSize = 5;
            chartArea.AxisX.LabelStyle.Angle = -15;


            chartArea.AxisX.LabelStyle.IsEndLabelVisible = true;        //show the last label
            chartArea.AxisX.Interval = 10;
            chartArea.AxisX.IntervalAutoMode = IntervalAutoMode.FixedCount;
            chartArea.AxisX.IntervalType = DateTimeIntervalType.NotSet;
            chartArea.AxisX.TextOrientation = TextOrientation.Auto;
            chartArea.AxisX.LineWidth = 2;
            chartArea.AxisX.LineColor = Color.Black;
            chartArea.AxisX.Enabled = AxisEnabled.True;
            chartArea.AxisX.ScaleView.MinSizeType = DateTimeIntervalType.Months;
            chartArea.AxisX.Crossing = 0;

            chartArea.Position.Height = 85;
            chartArea.Position.Width = 85;
            chartArea.Position.X = 5;
            chartArea.Position.Y = 7;

            chart.ChartAreas.Add(chartArea);
            chart.BackGradientStyle = GradientStyle.TopBottom;
            //图表的边框颜色、
            chart.BorderlineColor = Color.FromArgb(26, 59, 105);
            //图表的边框线条样式
            chart.BorderlineDashStyle = ChartDashStyle.Solid;
            //图表边框线条的宽度
            chart.BorderlineWidth = 2;
            //图表边框的皮肤
            chart.BorderSkin.SkinStyle = BorderSkinStyle.Emboss;

        }

        private void createSeries()
        {
            //Series1
            series1 = new Series();
            series1.ChartArea = "FirstArea";
            chart.Series.Add(series1);

            //Series1 style
            series1.ToolTip = "#VALX,#VALY";    //鼠标停留在数据点上,显示XY值

            series1.Name = "series1";
            series1.ChartType = SeriesChartType.Spline;  // type
            series1.BorderWidth = 2;
            series1.Color = Color.Red;
            series1.XValueType = ChartValueType.Time;//x axis type
            series1.YValueType = ChartValueType.Int32;//y axis type

            //Marker
            series1.MarkerStyle = MarkerStyle.Square;
            series1.MarkerSize = 5;
            series1.MarkerColor = Color.Black;

            this.chart.Legends.Clear();
        }


        static int range = 0;
        Random r = new Random(6);


        //用来设置切换视图时的视角
        private void chart_SelectionRangeChanged(object sender, CursorEventArgs e)
        {
            //无数据时返回
            if (chart.Series[0].Points.Count == 0)
                return;

            double start_position = 0.0;
            double end_position = 0.0;
            double myInterval = 0.0;
            start_position = e.NewSelectionStart;
            end_position = e.NewSelectionEnd;
            myInterval = Math.Abs(start_position - end_position);
            if (myInterval == 0.0)
                return;

            //X轴视图起点
            chart.ChartAreas[0].AxisX.ScaleView.Position = Math.Min(start_position, end_position);
            //X轴视图长度
            chart.ChartAreas[0].AxisX.ScaleView.Size = myInterval;
            //X轴间隔
            if (myInterval < 11.0)
            {
                chart.ChartAreas[0].AxisX.Interval = 1;
            }
            else
            {
                chart.ChartAreas[0].AxisX.Interval = Math.Floor(myInterval / 10);
            }
            flag = true;
            if (!comboBox1.Items.Contains("Zoom"))
            {
                comboBox1.Items.Add("Zoom");
                comboBox1.SelectedItem = "Zoom";
            }

        }

        private void comboBox1_SelectedIndexChanged(object sender, EventArgs e)
        {
            if (comboBox1.SelectedItem.ToString() == "Zoom")
            {
                flag = true;
            }
            else if (comboBox1.SelectedItem.ToString() == "OverView" || comboBox1.SelectedItem.ToString() == "Follow")
            {
                comboBox1.Items.Remove("Zoom");
                flag = false;
            }
        }

        private void t_Tick(object sender, EventArgs e)         //timer事件
        {
            if (flag)
                return;
            else
            {
                range = r.Next(1, 60);    //随机取数
                series1.Points.AddXY(sum, 5 + range);   //设置series点
                sum++;
                if (comboBox1.SelectedItem.ToString() == "OverView")    //切换试图
                {
                    chart.ChartAreas[0].AxisX.ScaleView.Position = 1;
                    if (sum > 10)
                    {
                        double max = chart.ChartAreas[0].AxisX.Maximum;
                        max = (sum / 10 + 1) * 10;
                        chart.ChartAreas[0].AxisX.Interval = max / 10;
                    }
                    chart.ChartAreas[0].AxisX.ScaleView.Size = sum * 1.1;
                    //chart.ChartAreas[0].AxisX.ScrollBar.ButtonStyle = ScrollBarButtonStyles.None;//启用X轴滚动条按钮
                }
                if (comboBox1.SelectedItem.ToString() == "Follow")
                {
                    chart.ChartAreas[0].AxisX.Interval = 1D;
                    chart.ChartAreas[0].AxisX.ScaleView.Size = 10D;
                    if (sum <= chart.ChartAreas[0].AxisX.ScaleView.Size)
                        chart.ChartAreas[0].AxisX.ScaleView.Position = 1;
                    else
                        chart.ChartAreas[0].AxisX.ScaleView.Position = sum - chart.ChartAreas[0].AxisX.ScaleView.Size;
                }
            }
        }

        private void button_Stop_Click_1(object sender, EventArgs e)  //切换停止开始按钮
        {
            switch (button_Stop.Text)
            {
                case "Stop":
                    {
                        button_Stop.Text = "Start";
                        t.Stop();
                        break;
                    }
                case "Start":
                    {
                        button_Stop.Text = "Stop";
                        t.Start();
                        break;
                    }
            }
        }

    }

}