安装tushare :
1.windows+R-cmd-conda install tushare
2.windows+R-cmd-pip install tushare
一、获取当前电影信息
import tushare as ts #导入tushare模块
df = ts.realtime_boxoffice()
二、检测股价的线性趋势
1.编写代码获取中国平安股票的收盘价和对应的日期数据
可参见http://tushare.org/index.html
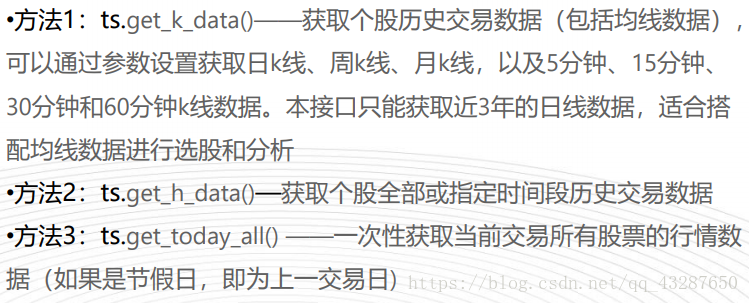
1).获取中国平安6月1日至今天的股票数据
语法:ts.get_h_data(‘股票代号’,start=’’,end=’’)
ts.get_h_data('601318',start='2018-06-01',end='2018-09-27')
2) 获取n天之前的 到今天的数据
获取今天前30天
from datetime import datetime
from datetime import timedelta
# 1.获取今天的日期
today = datetime.today()
# 2.构建一个时间间隔对象
time_g = timedelta(days=30) #30天的间隔
#3.得到开始日期
start_time = today-time_g
#4.获取数据
ts.get_h_data('601318',start=str(start_time.date()),end=str(today.date()))
3).获取中国平安 去年的今天到今天的股票(一年内的数据)
# 结束时间
end1 = str(datetime.today().date())
#开始时间
start1 = str((datetime.today()-timedelta(days=365)).date())
#获取数据
PA_One_Year = ts.get_h_data('601318',start=start1,end= end1)
提取日期和收盘价
#日期(日期就是索引列)
date = PA_One_Year.index
#提取收盘价
close = PA_One_Year['close']
2.画图,去出信号中的线性趋势
import matplotlib.pyplot as plt #导入画图的模块
from scipy import signal #导入去线性趋势的模块
plt.plot(date,close) #横轴为date,众轴为close的图
plt.plot(date,close,'o',date,close,'G') #数据点是'o',以绿色的线连接起来
#去线性趋势
y = signal.detrend(close)
#绘制股价数据以及将去除趋势后的信号从原始数据中减去所得到的潜在趋势
plt.plot(date,close,'o',date,close-y,'-')