I try to display seismograms using 'pssac' by the command:
gmt pssac *.z -JX20c/40c -R0/160/12/92 -Bx20+l'T(s)' -By2+lkm -BWSen -Ek -M1.5c -W0.5p,red >map.ps
and the figure I get is as belows:
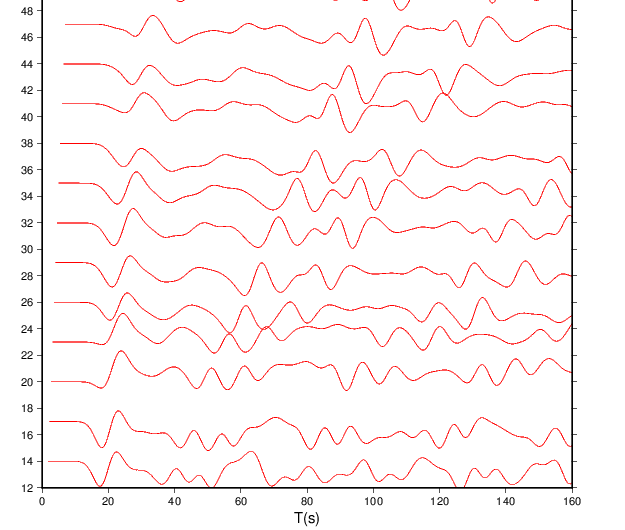
the problem is the "-JX", the character X, means the scaling factor that enlarges the seismograms, so I we need to make the number smaller, so I change the number after JX to 10c/10c.
The figure becomes:
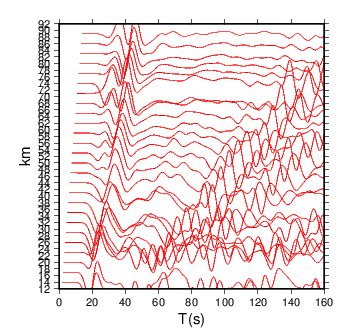
It is still not perfect, but it can hold all the seismograms.