由于Arcgis api 4.x版本与3.x版本相比改动较大,重要的是增加了越来越火的三维效果,因此本文用Arcgis api最新版本4.8集成了echarts最新版本4.x,这里暂时主要实现了点状图和二三维迁徙图的效果,下面对其进行概括介绍。
在arcgis api集成echarts中,一个最重要的点就是需要解决echarts坐标系与arcgis的坐标系不统一出现的问题,因此要进行echarts坐标系与arcgis坐标系的转换,这里采用的方法是注册一个坐标系统命名为arcgis(名称可自由拟定)的坐标系,注册arcgis坐标系方法如下:
registerCoordinateSystem('arcgis', getE3CoordinateSystem(view));在getE3CoordinateSystem函数中,对echarts里面的几个函数进行了重写,其中主要包含dataToPoint、pointToData等坐标转换内容。下面列出重写datatoPoint部分代码:
CoordSystem.prototype.dataToPoint = function dataToPoint(data) {
               var point  = {
                        type:"point",
                        x:data[0],
                        y:data[1],
                        spatialReference:map.spatialReference
                    };
               var px = map.toScreen(point);
               var mapOffset = this._mapOffset;
               return [px.x - mapOffset[0], px.y - mapOffset[1]];
               }
1.点状图效果的实现
点状图效果展示如下:
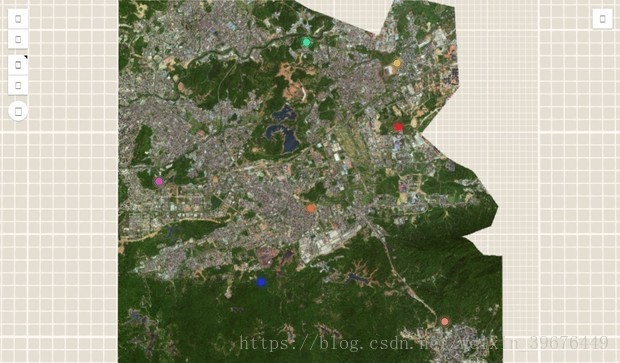
实现点状图时,将其option里面的参数设置在point.js里面,point.js中需要注意其中两个参数,第一个是series里面的coordinateSystem坐标系统参数设置为我们上面提到的自定义坐标系的名称arcgis,第二个是series里面的type类型参数设置为effectScatter类型,具体代码如下:
"series": [
        {
            "coordinateSystem": 'arcgis',
            "type": "effectScatter",
            "symbolSize": 10,
            "hoverAnimation": true,
            "itemStyle": {
                "color": "rgba(60,53,212,1)",
                "borderColor": "rgba(60,53,212,0.4)",
                "borderWidth": 10
            },
            "data": [
                {
                    "value": [139768.3512784773 ,40336.52033637449],
                    "itemStyle": {
                        "normal": {
                            "color": '#df27ba'
                        }
                    }
                }, {
                    "value": [143377.13448869827, 34190.918317994256],
                    "itemStyle": {
                        "normal": {
                            "color": '#3e31df'
                        }
                    }
                }, {
                    "value": [149523.23085095224, 37743.22494963202],
                    "itemStyle": {
                        "normal": {
                            "color": '#dfdf83'
                        }
                    }
                }
            ],

        }, {
            "zlevel": 5,
            "type": "scatter",
        }
    ]
2.二三维迁徙图的实现
二三维迁徙图效果如下图:
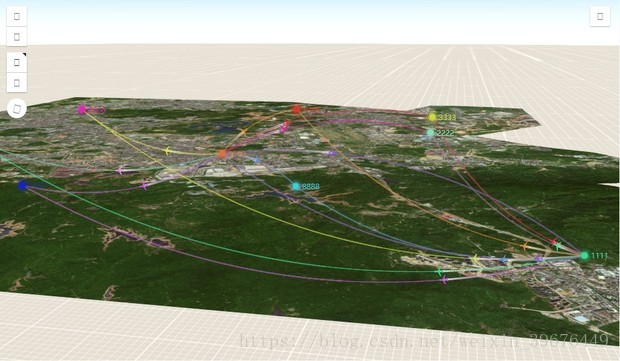
在实现二三维迁徙图功能中,将其option也配置在fly.js文件中,大体上其option配置项中与点状图相似,其主要不同主要体现在series里面type类型变为lines属性,其次在data的数据结构也有点状图有所不同,其数据结构如下:
[
    {
        coords:[[x1,y1],[x2,y2]],
        lineStyle: {
                        normal: {   color: ''}
                    }
    } ,
    {
        coords:[[x3,y3],[x4,y4]],
        lineStyle: {
                        normal: {   color: ''}
                    }
    }
]
在fly.js中其series配置代码如下:
"series": [
        {
            "coordinateSystem": 'arcgis',
            "type": "lines",
            "data": [
                {   coords:[[145650.2125361834,35475.377907489725],
                        [147863.73907776905, 32854.252960976206]],
                    lineStyle: {
                        normal: {
                            color: '#5A94DF'
                        }
                    }
                },
                {   coords:[[145650.2125361834,35475.377907489725],
                        [143285.08473504276,31947.453129980713]],
                    lineStyle: {
                        normal: {
                            color: '#c653df'
                        }
                    }
                }
            ],
            "effect": {
                "show": true,
                "period": 6,
                "trailLength": 0.7,
                "color": '#fff',
                "symbolSize": 3
            },
            "silent": true,
            "lineStyle": {
                "normal": {
                    "color": "#fdf824",
                    "width": 0.1,
                    "curveness": 0.2
                }
            },
            "zlevel": 1,
        },
        {
            "coordinateSystem": 'arcgis',
            "type": "lines",
            "data": [
                {   coords:[[145650.2125361834,35475.377907489725],
                        [147863.73907776905, 32854.252960976206]],
                    lineStyle: {
                        normal: {
                            color: '#5A94DF'
                        }
                    }
                },
                {   coords:[[145650.2125361834,35475.377907489725],
                        [143285.08473504276,31947.453129980713]],
                    lineStyle: {
                        normal: {
                            color: '#c653df'
                        }
                    }
                },
            ],
            "lineStyle": {
                "normal": {
                    "color": "#fdd1bf",
                    "width": 1,
                    "opacity": 0.4,
                    "curveness": 0.2
                }
            },
            "effect": {
                "show": true,
                "period": 6,
                "trailLength": 0,
                 "symbol": 'path://M1705.06,1318.313v-89.254l-319.9-221.799l0.073-208.063c0.521-84.662-26.629-121.796-63.961-121.491c-37.332-0.305-64.482,36.829-63.961,121.491l0.073,208.063l-319.9,221.799v89.254l330.343-157.288l12.238,241.308l-134.449,92.931l0.531,42.034l175.125-42.917l175.125,42.917l0.531-42.034l-134.449-92.931l12.238-241.308L1705.06,1318.313z',
                "symbolSize": 15
            },
            "zlevel": 2,
        },
        {
            name: '2',
            type: 'effectScatter',
            coordinateSystem: 'arcgis',
            zlevel: 3,
            rippleEffect: {
                brushType: 'stroke'
            },
            label: {
                normal: {
                    show: true,
                    position: 'right',
                    formatter: '{b}'
                }
            },
            symbolSize: 10,
            itemStyle: {
                normal: {
                    color: "#0f19fd"
                }
            },
            data: [
                {
                    name: "2222",
                    value:[149852.10436049147, 39369.23614401659],
                    itemStyle: {
                        normal: {
                            color: '#85dfbc'
                        }
                    }
                },
                {
                    name: "1111",
                    value:[152048.29245357122,30062.143397137097],
                    itemStyle: {
                        normal: {
                            color: '#29df95'
                        }
                    }
                }
            ],
        }
    ]
3.总结
上面即完成Arcgis api 4.x版本集成最新echarts4.x版本,实现了点状图和二三维迁徙图的功能效果,总之,最关键的部分就是注册坐标系统和使用,只要抓住了这个思路,实现该功能就会很容易了,而且这种方法是可以自己定义任意坐标系,不受坐标系的限制。我还尝试了做一点三维柱状图的效果,但是目前在webGL方面还没研究透彻,如果有实现了该功能的朋友们欢迎分享。