选自过去1~2周的内容: https://twitter.com/unity3d
1) cedec2018unity 上的一个PPT 可以阅读一下: 可以看到Unity现在最新的一些功能,将来后续版本可能会有的功能
https://www.slideshare.net/UnityTechnologiesJapan/cedec2018unity
2) 在 2017.1+ 版本之后可以在Unity就可以查看 非编辑器下游戏的Log了: 可以告别安卓的ADB了~

3) 今天发现, Unity在 2017.1 和 Unity5.6 版本之后 Profiling的API 有增加
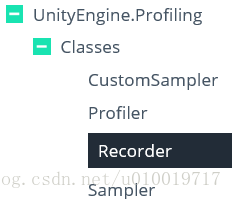
今天看到了 CustomSampler 类:
using UnityEngine; using UnityEngine.Profiling;
public class ExampleClass : MonoBehaviour { CustomSampler sampler; void Start() { sampler = CustomSampler.Create("MyCustomSampler"); }
void Update() { sampler.Begin(); // do something that takes a lot of time sampler.End(); } }
4) Unity 2018.3 预览版正在开发新的 Memory Profiler 工具, 可以通过 PackageManager 安装
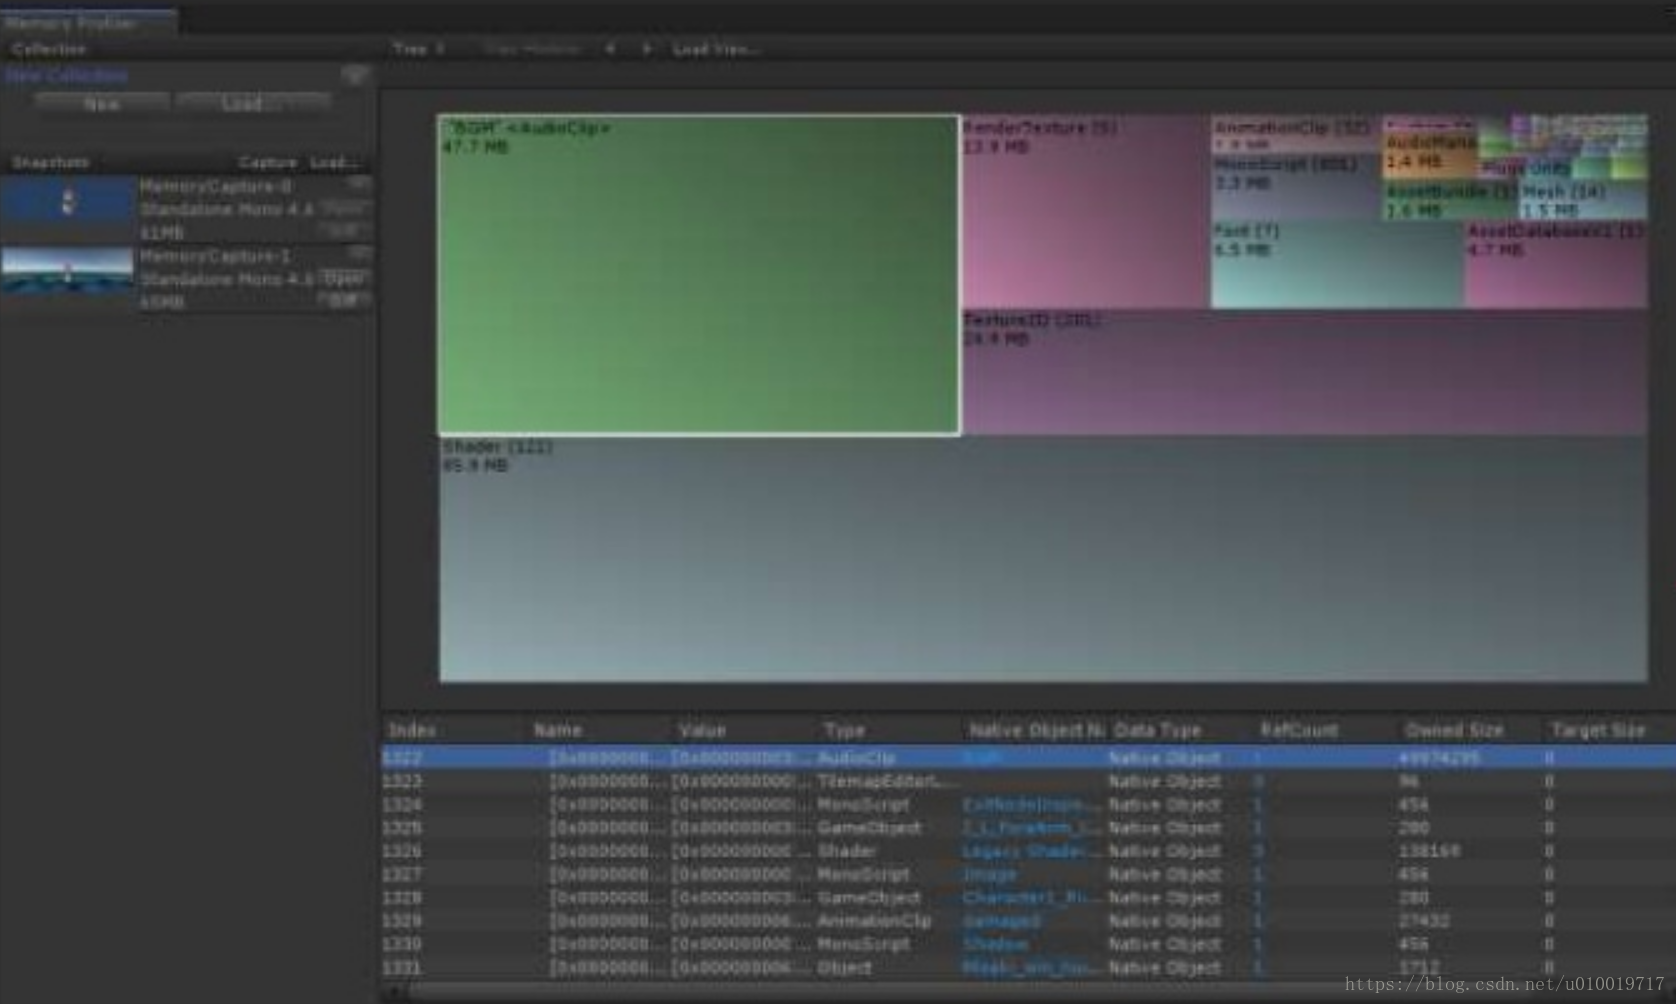
之前官方的: https://bitbucket.org/Unity-Technologies/memoryprofiler
针对他的扩展:
https://github.com/robertoardila/support-unity-memoryprofiler 需要IL2CPP构建,依赖关系以图形方式显示
https://github.com/GameBuildingBlocks/PerfAssist/
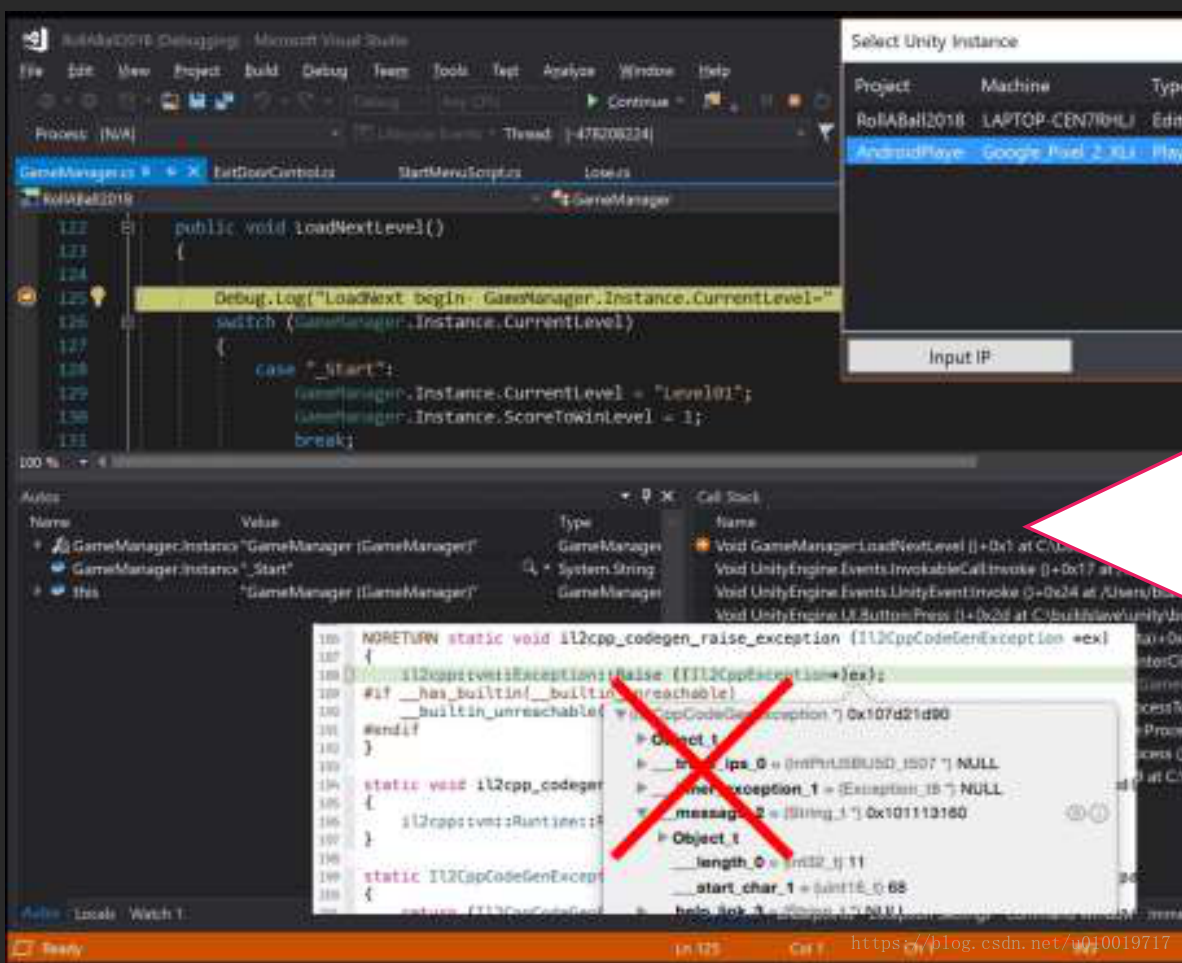
5) 使用IL2CPP进行脚本调试
•从2018.2 开始推出
•PC / iOS / Android / Console
•它仅支持“.Net 4.x Equivalement”
*从附加到Process到识别断点有大约10秒的延迟。
6) 支持Native Plugin回调(2018.2+)
从2018.2开始推出
怎么用?
在安装路径 Editor / Data / PluginAPI / IUnityProfilerCallbacks.h 下:
如何使用 自己查吧!!!!
如果您将数据保存在Native Plugin端并创建一个工具来显示它,您也可以创建自己的Profiler。
他在Android的Systrace上从Unity Profiler获得了信息并将其放在Android的Systrace上 项目地址: https://github.com/Over17/UnitySystracePlugin
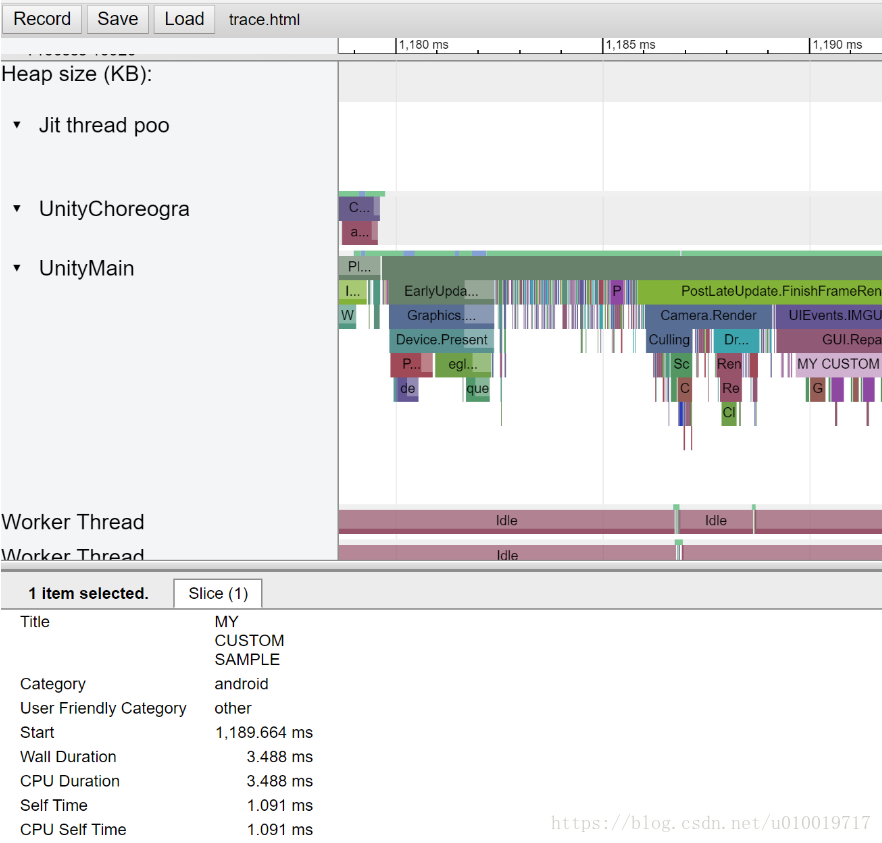
7) Profiler 中可以显示 用户自己的线程执行情况
Thread th = new Thread(ThreadExec);
th.Start();
static void ThreadExec(){
CustomSampler sampler = CustomSampler.Create("Exec");
Profiler.BeginThreadProfiling("User","DoSomething");
while (flag){
sampler.Begin();
Exec(); // .. 处理一些事情
sampler.End();
}
Profiler.EndThreadProfiling();
}
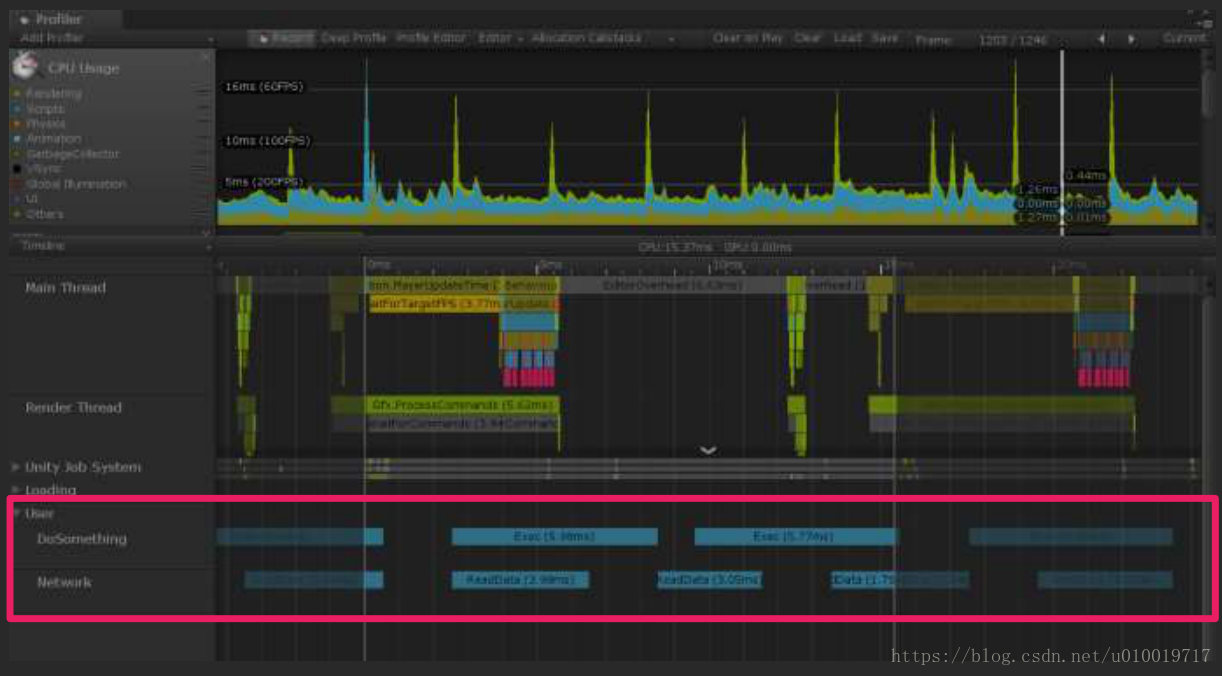
这里要注意, 从2018.3开始在C#中创建的线程将自动注册。
8)检索加载的资产列表
通过使用Resources.FindObjectsOfTypeAll,可以在运行时枚举内存中的资产。
* 如果在编辑器上执行此操作,则执行编辑器时加载的资源也将被枚举,因此您需要在实际的机器上执行此操作。
比如可以在项目的空场景测试,在Awake中调用并打印资源信息,就可以看到Unity在启动之前都加载了哪些东西,做了什么操作。
可以这样:
Texture2D[] textures =
Resources.FindObjectsOfTypeAll<Texture2D>();
Mesh[] meshes =
Resources.FindObjectsOfTypeAll<Mesh>();
AudioClip[] audioClips =
Resources.FindObjectsOfTypeAll<AudioClip>();
AnimationClip[] animationClips =
Resources.FindObjectsOfTypeAll<AnimationClip>();
最好直接
Object[] = Resources.FindObjectsOfTypeAll<Object>();
9) 实际机器上的深度剖析Deep Profiling
以前在实际机器上的DeepProfiling是没有的功能,现在(2017.3+版本) 通过将“ - deepprofiling”作为参数传递并执行它,DeepProfiling在实际机器上成为可能
注意 *仅限Mono .Net 4.x系列
在Android上传递参数:
在Android上,您可以通过使用以下adb命令指定参数来执行应用程序
adb shell am start -n [package name] / [activity name] -e“unity -deepprofiling”
示例:adb shell am start - n com.unity.test / com.unity 3 d.player.UnityPlayerActivity - e“unity - depprofiling
使用Profiler API获得
•托管内存的使用状态
•Profiler.GetMonoHeapSizeLong
•Profiler.GetMonoUsedSizeLong
•Unity保护的内存使用情况
•Profiler.GetRuntimeMemorySizeLong
•Profiler.GetTotalReservedMemoryLong
•Profiler.GetTotalUnusedReservedMemoryLong
10) 有必要每天简单地进行性能测量 。 让我们确保每天在目标终端上没有性能问题。
重要的是使性能“可见”,使其在实际机器上可以被视觉识别
使用Time.realtimeSinceStartup:
void Update(){
float startTime = Time.realtimeSinceStartup;
DoSomething();
float executeTime = Time.realtimeSinceStartup - startTime;
Debug.Log(string.Format("DoSomething花了{0} ms", executeTime * 1000.0f));
}
还利用PlayerLoop: Unity 2018.1 之后才有
实验性的API: https://docs.unity3d.com/2018.1/Documentation/ScriptReference/Experimental.LowLevel.PlayerLoop.html
http://beardphantom.com/ghost-stories/unity-2018-and-playerloop/
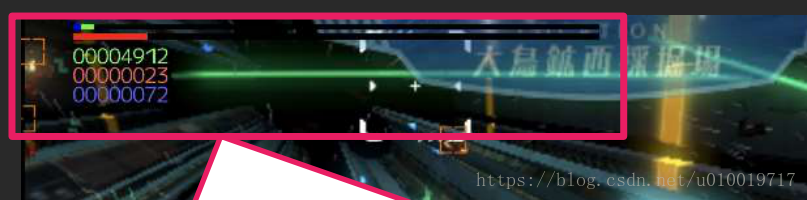
这里有一个对他的运用: https://github.com/wotakuro/MainLoopProfilingSample 他是日本Unity成员, 项目很多,其中一定要推荐的 https://github.com/wotakuro/StringBuilderTemporary 。

1. MainThread execute time meter.
blue:Script
orange:Physics
red:Animator
green:Render
purple:Other
2.RenderThread execute time meter.
3.Latest 1 sec framerate information.
4.Latest 1 sec minimum/maximum execute time for 1 frame.
关于 关于PlayerLoop , 大概是这样的流程:
MonoBehaviour Update处理,Animator处理,MonoBehaviour LateUpdate处理, 等......
原理就是 在Unity处理期间(Animator处理的前后)插入您自己的C#处理。 您可以将它与Time.realtimeSinceStartup结合使用以获取更多信息。