数据说明
- 数据信息:
- 数据量:40多万条观测,20多个列变量
- 时间:2018年5月前
- 数据来源
- 作者:田昕峣
- 获取方式:https://github.com/XinyaoTian/lianjia_Spider
项目目标
- 建立单位面积房价的预测模型
内容目录
数据导入
import numpy as np
import pandas as pd
import matplotlib.pyplot as plt
plt.rcParams['font.sans-serif'] = ['SimHei']
plt.rcParams['font.family']='sans-serif' # 解决负号是方块
%matplotlib notebook

import seaborn as sns
color = sns.color_palette()
sns.set_style('darkgrid')
import warnings
def ignore_warn(*args, **kwargs):
    pass
warnings.warn = ignore_warn

import re
from scipy import stats
from scipy.stats import norm, skew


pd.set_option('display.float_format', lambda x: '{:.3f}'.format(x)) #Limiting floats output
pd.set_option('display.max_columns',40) # 显示隐藏
dataset = pd.read_csv('./houseInfo.csv')
a = dataset.ix[1, 'info_cluster']
dataset.head(5)
| introduction_house | community_house | href_house | unit_house | size_house | direction_house | decoration_house | elevator_house | type_house | years_house | area_house | interests_house | watch_times | submit_period | years_period | tax_free | total_price | smeter_price | region | info_cluster | info_flood | info_follow | |
|---|---|---|---|---|---|---|---|---|---|---|---|---|---|---|---|---|---|---|---|---|---|---|
| 0 | 电梯花园洋房,开发商精装修带家具家电,小区人车分流 | 麓山国际帕萨迪纳3组 | https://cd.lianjia.com/ershoufang/106101085290... | NaN | NaN | NaN | NaN | NaN | NaN | NaN | 麓山 | NaN | NaN | NaN | NaN | NaN | 250.000 | 单价25492元/平米 | cd | | 2室2厅 | 98.07平米 | 南 | 其他 | 有电梯 | 高楼层(共9层)2008年建板塔结合 - | 3人关注 / 共0次带看 / 2个月以前发布 |
| 1 | 天府新区麓山国际跃层洋房纯清水出售 | 麓山国际塞尔维蒙 | https://cd.lianjia.com/ershoufang/106101067528... | NaN | NaN | NaN | NaN | NaN | NaN | NaN | 麓山 | NaN | NaN | NaN | NaN | NaN | 420.000 | 单价20389元/平米 | cd | | 叠拼别墅 | 5室1厅 | 206平米 | 南 | 其他 | 无电梯 | 上叠(共4层)2008年建暂无数据 - | 36人关注 / 共2次带看 / 2个月以前发布 |
| 2 | 麓山国际半月湾跃层,户型通透采光良好楼距开阔视野好 | 麓山国际半月湾 | https://cd.lianjia.com/ershoufang/106101136261... | NaN | NaN | NaN | NaN | NaN | NaN | NaN | 麓山 | NaN | NaN | NaN | NaN | NaN | 275.000 | 单价24512元/平米 | cd | | 2室2厅 | 112.19平米 | 东南 | 其他 | 高楼层(共16层)2013年建板楼 - | 43人关注 / 共1次带看 / 1个月以前发布 |
| 3 | 中丝园 装修 套三单卫 带车位 ! | 心怡中丝园 | https://cd.lianjia.com/ershoufang/106101229408... | NaN | NaN | NaN | NaN | NaN | NaN | NaN | 麓山 | NaN | NaN | NaN | NaN | NaN | 193.000 | 单价22043元/平米 | cd | | 3室2厅 | 87.56平米 | 南 | 其他 | 有电梯 | 高楼层(共33层)2015年建板塔结合 - | 1人关注 / 共0次带看 / 12天以前发布 |
| 4 | 麓山国际因特拉肯A区+套三双卫+对中庭+看湖带装修 | 麓山国际茵特拉肯A | https://cd.lianjia.com/ershoufang/106101233740... | NaN | NaN | NaN | NaN | NaN | NaN | NaN | 麓山 | NaN | NaN | NaN | NaN | NaN | 300.000 | 单价23303元/平米 | cd | | 3室2厅 | 128.74平米 | 西南 | 其他 | 中楼层(共11层)2016年建板楼 - | 0人关注 / 共0次带看 / 10天以前发布 |
数据探索:
- 查看数据集中的变量情况
dataset.info()
<class 'pandas.core.frame.DataFrame'>
RangeIndex: 474301 entries, 0 to 474300
Data columns (total 22 columns):
introduction_house    474301 non-null object
community_house       474301 non-null object
href_house            474301 non-null object
unit_house            38137 non-null object
size_house            38137 non-null object
direction_house       38137 non-null object
decoration_house      38109 non-null object
elevator_house        37093 non-null object
type_house            38137 non-null object
years_house           38100 non-null object
area_house            474301 non-null object
interests_house       38137 non-null object
watch_times           38137 non-null object
submit_period         38137 non-null object
years_period          30543 non-null object
tax_free              35260 non-null object
total_price           474301 non-null float64
smeter_price          474301 non-null object
region                474301 non-null object
info_cluster          436164 non-null object
info_flood            436164 non-null object
info_follow           436164 non-null object
dtypes: float64(1), object(21)
memory usage: 79.6+ MB
dataset.describe()
| total_price | |
|---|---|
| count | 474301.000 |
| mean | 329.913 |
| std | 371.062 |
| min | 4.000 |
| 25% | 143.000 |
| 50% | 235.000 |
| 75% | 390.000 |
| max | 60000.000 |
# 检查数据维度
print("训练集特征前的size:",dataset.shape)
训练集特征前的size: (474301, 22)
数据处理:
def size_help_func(x):
#     pattern = re.compile(r'\d+')
#     match = pattern.search(x)
    x = str(x)
    x = x.replace('平方米','')
    x = x.replace('平米','')
    x = x.replace('米','')

    if (('室' in x) | ('厅' in x)|(x=='nan')|('车位' in x)|('房' in x)|('墅' in x)):
        num = 0
    else:
        num = float(x)

#     if ('米' in (x))==True:
#         x = x.replace('平米','')
#         num = float(x.strip())

#     else:
#         num = 0

    return num

def info_func(x):

    if '平米' in str(x):
        a = x.split('平米')[0].split('|')[-1].strip()
        if len(a)>1 :
            num = a
        else:
            num = 0.0
    else:
        num = 0.0
    return num

def size_func(x,y):
    a = size_help_func(x)
    b = info_func(y)

    if a == 0.0:
        if ('车位' not in str(b)):
            num = float(b)
        else:
            num = a
    else:
        num =a

    return num

def size_addcata_func(a):
#     a = watch_time_func(x)
    if a <= 10:
        label = str(1)
    else:
        label = str(0)
    return label


def watch_time_func(x):
    if str(x) == 'nan':
        num = -1
    else:
        a = x.split('次')[0].strip()
        num = int(a)
    return num

def watch_time_addcata_func(x):
#     a = watch_time_func(x)
    if x == -1:
        label = str(1)
    else:
        label = str(0)
    return label

def interests_house_func(x):
    if str(x) == 'nan':
        num = -1
    else:
        a = x.split('人')[0].strip()
        num = int(a)
    return num

def interests_house_addcata_func(x):
#     a = interests_house_func(x)
    if x == -1:
        label = str(1)
    else:
        label = str(0)
    return label

def submit_period_func(x):
    if str(x) == 'nan':
        num = -1
    elif '刚刚' in str(x):
        num = 0
    elif '年' in str(x):
        a = x.split('年')[0].strip()
        if a == '一':
            num = 365
        elif a == '二':
            num = 730
        else:
            num = 1000
    elif '个月' in x:
        a = x.split('个月')[0].strip()
        num = int(a)* 30
    elif '天' in x:
        a = x.split('天')[0].strip()
        num = int(a)
    else:
        num = -2
    return num

def submit_period_addcata_func(x):
    a = submit_period_func(x)
    if a == -2:
        label = 3
    elif a == -1:
        label = 2
    elif a == 1000:
        label = 1
    else:
        label = 0
    return str(label)

def years_period_func(x):
    if str(x) == 'nan':
        label = str(0)
    else:
        label = str(1)
    return label
# def tax_free_func(x):
#     if str(x) == 'nan':
#         label = str(0)
#     else:
#         label = str(1)
#     return label

def smeter_price_func(x):
    a = x.split('元')[0].replace('单价','')
    if len(a) <= 3:
        num = -1
    else:
        num = int(a)
    return num

def direction_func(x,y,z):
    x = str(x)
    y = str(y)
    z = str(z)
    dir_list = ['东','西','南','北']
    if ((dir_list[0] in x)|(dir_list[1] in x)|(dir_list[2] in x)|(dir_list[3] in x)):
        label = x
    elif (dir_list[0] in y)|(dir_list[1] in y)|(dir_list[2] in y)|(dir_list[3] in y):
        label = y
    elif (dir_list[0] in z)|(dir_list[1] in z)|(dir_list[2] in z)|(dir_list[3] in z):
        a = z.split('|')
        for value in a:
            if (dir_list[0] in value)|(dir_list[1] in value)|(dir_list[2] in value)|(dir_list[3] in value):
                label = value
            else:
                label = 'nodata'
    else:
        label = 'nodata'

    return label

def decoration_func(x,y,z):
    x = str(x)
    y = str(y)
    z = str(z)
    dir_list = ['精装', '其他', '毛坯', '简装']
    if ((dir_list[0] in x)|(dir_list[1] in x)|(dir_list[2] in x)|(dir_list[3] in x)):
        label = x.strip()
    elif (dir_list[0] in y)|(dir_list[1] in y)|(dir_list[2] in y)|(dir_list[3] in y):
        label = y.strip()
    elif (dir_list[0] in z)|(dir_list[1] in z)|(dir_list[2] in z)|(dir_list[3] in z):
        a = z.split('|')
        for value in a:
            if (dir_list[0] in value)|(dir_list[1] in value)|(dir_list[2] in value)|(dir_list[3] in value):
                label = value.strip()
            else:
                label = 'nodata'
    else:
        label = 'nodata'

    return label

def elevator_func(x,y,z):
    '''
    x-decoration_house
    y-elevator_house
    z-info_cluster
    '''
    x = str(x)
    y = str(y)
    z = str(z)
    dir_list = ['有电梯', '无电梯']
    if (dir_list[0] in x)|(dir_list[1] in x):
        label = x.strip()
    elif (dir_list[0] in y)|(dir_list[1] in y):
        label = y.strip()
    elif (dir_list[0] in z)|(dir_list[1] in z):
        a = z.split('|')
        for value in a:
            if (dir_list[0] in value)|(dir_list[1] in value):
                label = value.strip()
            else:
                label = 'nodata'
    else:
        label = 'nodata'
    return label

def floor_type_func(x):
    x = str(x)
    if '共' in x:
        a = x.split('(')[0]
        label = a
    elif '层' in x:
        a = x.split('层')[0]
        a = int(a)
        if a <=1:
            label = '底层'
        elif (a >1)|(a<6):
            label = '低楼层'
        elif (a >=6)|(a<15):
            label = '中楼层'
        else:
            label = '高楼层'
    elif '平房' in x:
        label = '底层'
    elif x == 'nan':
        label = 'nodata'
    else:
        label = 'nodata'
    return label

def years_house_type_func(x,y):
    x = str(x)
    y = str(y)
    type_list = ['板塔','板','塔','平房','叠']
    if (type_list[0] in x)|(type_list[0] in y):
        label = '板塔'
    elif (type_list[1] in x)|(type_list[1] in y):
        label = '板'
    elif (type_list[2] in x)|(type_list[2] in y):
        label = '塔'
    elif (type_list[3] in x)|(type_list[3] in y):
        label = '平房'
    elif (type_list[4] in x)|(type_list[4] in y):
        label = '别墅'
    else:
        label = 'nodata'
    return label

def years_house_year_func(x,y):
    x = str(x)
    y = str(y)
    if ('年' in x):
        a = x.split('年')[0].replace('\'','').strip()
        num = int(a)
    elif ('年' in y):
        a = y.split('年')[0].replace('\'','').strip()
        num = int(a)
    else:
        num = None

    return num
dataset.columns
Index(['introduction_house', 'community_house', 'href_house', 'unit_house',
       'size_house', 'direction_house', 'decoration_house', 'elevator_house',
       'type_house', 'years_house', 'area_house', 'interests_house',
       'watch_times', 'submit_period', 'years_period', 'tax_free',
       'total_price', 'smeter_price', 'region', 'info_cluster', 'info_flood',
       'info_follow'],
      dtype='object')
dataset['submit_period'].apply(submit_period_func)
0        -1
1        -1
2        -1
3        -1
4        -1
5        -1
6        -1
7        -1
8        -1
9        -1
10       -1
11       -1
12       -1
13       -1
14       -1
15       -1
16       -1
17       -1
18       -1
19       -1
20       -1
21       -1
22       -1
23       -1
24       -1
25       -1
26       -1
27       -1
28       -1
29       -1
         ..
474271   -1
474272   -1
474273   -1
474274   -1
474275   -1
474276   -1
474277   -1
474278   -1
474279   -1
474280   -1
474281   -1
474282   -1
474283   -1
474284   -1
474285   -1
474286   -1
474287   -1
474288   -1
474289   -1
474290   -1
474291   -1
474292   -1
474293   -1
474294   -1
474295   -1
474296   -1
474297   -1
474298   -1
474299   -1
474300   -1
Name: submit_period, Length: 474301, dtype: int64
dataset['years_house_year_edit1'] = list(map(lambda x, y: years_house_year_func(x,y), dataset['type_house'],dataset['years_house']))
dataset['size_house_edit1'] = list(map(lambda x, y: size_func(x,y), dataset['unit_house'],dataset['info_cluster']))
dataset['size_house_edit1_addcata'] = dataset['size_house_edit1'].apply(size_addcata_func)

dataset['watch_time_edit1'] = dataset['watch_times'].apply(watch_time_func)
dataset['watch_time_edit1_addcata'] = dataset['watch_time_edit1'].apply(watch_time_addcata_func)

dataset['interests_house_edit1'] = dataset['interests_house'].apply(interests_house_func)
dataset['interests_house_edit1_addcata'] = dataset['interests_house_edit1'].apply(interests_house_addcata_func)

dataset['submit_period_edit1'] = dataset['submit_period'].apply(submit_period_func)
dataset['submit_period_edit1_addcata'] = dataset['submit_period'].apply(submit_period_addcata_func)
dataset['years_period_edit1'] = dataset['years_period'].apply(years_period_func)
dataset['tax_free_edit1'] = dataset['tax_free'].apply(years_period_func)

dataset['smeter_price_edit1'] = dataset['smeter_price'].apply(smeter_price_func)

dataset['direction_edit1'] = list(map(lambda x, y, z: direction_func(x,y,z), dataset['direction_house'],dataset['decoration_house'],dataset['info_cluster']))
dataset['decoration_edit1'] = list(map(lambda x, y, z: decoration_func(x,y,z), dataset['direction_house'],dataset['decoration_house'],dataset['info_cluster']))
dataset['elevator_edit1'] = list(map(lambda x, y, z: elevator_func(x,y,z), dataset['decoration_house'],dataset['elevator_house'],dataset['info_cluster']))

dataset['type_house_edit1'] = dataset['type_house'].apply(floor_type_func)
dataset['years_house_type_edit1'] = list(map(lambda x, y: years_house_type_func(x,y), dataset['type_house'],dataset['years_house']))
dataset['years_house_year_edit1'] = list(map(lambda x, y: years_house_year_func(x,y), dataset['type_house'],dataset['years_house']))
print('房屋小区类型:', len(dataset['community_house'].unique()));

print('房屋户型:', len(dataset['unit_house'].unique()))

print('房屋面积:', 'max:',max(dataset['size_house_edit1'].unique()),
      'min:',min(dataset['size_house_edit1'].unique()),
      '空值:',len(dataset[dataset['size_house_edit1']==0.]))

print('房屋朝向:', len(dataset['direction_house'].unique()))

print('看房次数:', 'max:',max(dataset['watch_time_edit1'].unique()),
      'min:',min(dataset['watch_time_edit1'].unique()),
      '空值:',len(dataset[dataset['watch_time_edit1']==-1]))

print('收藏次数:', 'max:',max(dataset['interests_house_edit1'].unique()),
      'min:',min(dataset['interests_house_edit1'].unique()),
      '空值:',len(dataset[dataset['interests_house_edit1']==-1]))

print('多久前发布:', 'max:',max(dataset['submit_period_edit1'].unique()),
      'min:',min(dataset['submit_period_edit1'].unique()),
      '空值:',len(dataset[dataset['submit_period_edit1']==-1]))

print('多久前发布的类型:', len(dataset['submit_period_edit1_addcata'].unique()))
print('2年产权类型:', len(dataset['years_period_edit1'].unique()))
print('5年产权类型:', len(dataset['tax_free_edit1'].unique()))

print('总价:', 'max:',max(dataset['total_price'].unique()),
      'min:',min(dataset['total_price'].unique()),
      '空值:',len(dataset[dataset['total_price']==-1]))

print('单位价钱:', 'max:',max(dataset['smeter_price_edit1'].unique()),
      'min:',min(dataset['smeter_price_edit1'].unique()),
      '空值:',len(dataset[dataset['smeter_price_edit1']==-1]))
房屋小区类型: 55148
房屋户型: 77
房屋面积: max: 12017.0 min: 0.0 空值: 67263
房屋朝向: 203
看房次数: max: 851 min: -1 空值: 436164
收藏次数: max: 2701 min: -1 空值: 436164
多久前发布: max: 365 min: -1 空值: 436164
多久前发布的类型: 2
2年产权类型: 2
5年产权类型: 2
总价: max: 60000.0 min: 4.0 空值: 0
总价: max: 199984 min: -1 空值: 2
dataset[dataset['direction_house']=='东 南 西 北'][['info_cluster','direction_house','decoration_house','info_flood']]
| info_cluster | direction_house | decoration_house | info_flood | |
|---|---|---|---|---|
| 337737 | NaN | 东 南 西 北 | 精装 | NaN |
| 342204 | NaN | 东 南 西 北 | 其他 | NaN |
| 342205 | NaN | 东 南 西 北 | 毛坯 | NaN |
| 342234 | NaN | 东 南 西 北 | 精装 | NaN |
| 353429 | NaN | 东 南 西 北 | 有电梯 | NaN |
| 353431 | NaN | 东 南 西 北 | 有电梯 | NaN |
| 353447 | NaN | 东 南 西 北 | 无电梯 | NaN |
| 354963 | NaN | 东 南 西 北 | 精装 | NaN |
| 354965 | NaN | 东 南 西 北 | 精装 | NaN |
| 359978 | NaN | 东 南 西 北 | 精装 | NaN |
| 360325 | NaN | 东 南 西 北 | 精装 | NaN |
| 360482 | NaN | 东 南 西 北 | 精装 | NaN |
| 365587 | NaN | 东 南 西 北 | 其他 | NaN |
| 365752 | NaN | 东 南 西 北 | 简装 | NaN |
| 366365 | NaN | 东 南 西 北 | 简装 | NaN |
| 367228 | NaN | 东 南 西 北 | 其他 | NaN |
| 371544 | NaN | 东 南 西 北 | 精装 | NaN |
| 371572 | NaN | 东 南 西 北 | 毛坯 | NaN |
| 371614 | NaN | 东 南 西 北 | 精装 | NaN |
| 371670 | NaN | 东 南 西 北 | 精装 | NaN |
| 371926 | NaN | 东 南 西 北 | 简装 | NaN |
| 371928 | NaN | 东 南 西 北 | 其他 | NaN |
| 371951 | NaN | 东 南 西 北 | 精装 | NaN |
| 371971 | NaN | 东 南 西 北 | 精装 | NaN |
| 371972 | NaN | 东 南 西 北 | 精装 | NaN |
| 372001 | NaN | 东 南 西 北 | 精装 | NaN |
| 372042 | NaN | 东 南 西 北 | 毛坯 | NaN |
| 372058 | NaN | 东 南 西 北 | 精装 | NaN |
| 372074 | NaN | 东 南 西 北 | 毛坯 | NaN |
| 372087 | NaN | 东 南 西 北 | 精装 | NaN |
| ... | ... | ... | ... | ... |
| 457320 | NaN | 东 南 西 北 | 精装 | NaN |
| 457803 | NaN | 东 南 西 北 | 简装 | NaN |
| 458709 | NaN | 东 南 西 北 | 简装 | NaN |
| 458729 | NaN | 东 南 西 北 | 简装 | NaN |
| 458986 | NaN | 东 南 西 北 | 精装 | NaN |
| 459079 | NaN | 东 南 西 北 | 精装 | NaN |
| 459329 | NaN | 东 南 西 北 | 有电梯 | NaN |
| 461873 | NaN | 东 南 西 北 | 精装 | NaN |
| 462182 | NaN | 东 南 西 北 | 简装 | NaN |
| 463843 | NaN | 东 南 西 北 | 其他 | NaN |
| 464149 | NaN | 东 南 西 北 | 精装 | NaN |
| 464420 | NaN | 东 南 西 北 | 毛坯 | NaN |
| 466154 | NaN | 东 南 西 北 | 简装 | NaN |
| 466251 | NaN | 东 南 西 北 | 精装 | NaN |
| 466384 | NaN | 东 南 西 北 | 精装 | NaN |
| 466511 | NaN | 东 南 西 北 | 精装 | NaN |
| 466682 | NaN | 东 南 西 北 | 精装 | NaN |
| 467575 | NaN | 东 南 西 北 | 简装 | NaN |
| 467610 | NaN | 东 南 西 北 | 精装 | NaN |
| 468418 | NaN | 东 南 西 北 | 简装 | NaN |
| 468430 | NaN | 东 南 西 北 | 简装 | NaN |
| 468437 | NaN | 东 南 西 北 | 精装 | NaN |
| 468438 | NaN | 东 南 西 北 | 精装 | NaN |
| 468472 | NaN | 东 南 西 北 | 其他 | NaN |
| 468798 | NaN | 东 南 西 北 | 精装 | NaN |
| 470970 | NaN | 东 南 西 北 | 简装 | NaN |
| 471830 | NaN | 东 南 西 北 | 简装 | NaN |
| 471920 | NaN | 东 南 西 北 | 精装 | NaN |
| 472977 | NaN | 东 南 西 北 | 精装 | NaN |
| 473544 | NaN | 东 南 西 北 | 精装 | NaN |
130 rows × 4 columns
dataset['info_flood'].unique()
array(['高楼层(共9层)2008年建板塔结合  -  ', '上叠(共4层)2008年建暂无数据  -  ',
       '高楼层(共16层)2013年建板楼  -  ', ..., '低楼层(共4层)2009年建塔楼  -  ',
       '中楼层(共38层)2015年建塔楼  -  ', '1层2005年建塔楼  -  '], dtype=object)
dataset['type_house'].unique()
array([nan, '2层', '顶层(共6层)', '底层(共2层)', '高楼层(共6层)', '中楼层(共17层)',
       '顶层(共9层)', '低楼层(共16层)', '高楼层(共16层)', '高楼层(共7层)', '低楼层(共3层)', '3层',
       '中楼层(共5层)', '底层(共9层)', '中楼层(共10层)', '中楼层(共4层)', '中楼层(共6层)',
       '底层(共3层)', '5层', '底层(共1层)', '顶层(共3层)', '高楼层(共15层)', '中楼层(共9层)',
       '低楼层(共11层)', '高楼层(共13层)', '底层(共6层)', '底层(共15层)', '底层(共11层)',
       '低楼层(共17层)', '顶层(共2层)', '顶层(共5层)', '低楼层(共15层)', '顶层(共16层)',
       '高楼层(共10层)', '低楼层(共9层)', '中楼层(共15层)', '顶层(共14层)', '中楼层(共13层)',
       '中楼层(共20层)', '低楼层(共18层)', '高楼层(共9层)', '底层(共5层)', '中楼层(共14层)',
       '底层(共16层)', '低楼层(共13层)', '顶层(共4层)', '低楼层(共10层)', '底层(共4层)',
       '底层(共18层)', '低楼层(共6层)', '顶层(共8层)', '高楼层(共18层)', '中楼层(共18层)',
       '顶层(共17层)', '中楼层(共11层)', '底层(共12层)', '高楼层(共12层)', '顶层(共11层)',
       '高楼层(共17层)', '顶层(共12层)', '中楼层(共12层)', '中楼层(共7层)', '底层(共14层)',
       '中楼层(共16层)', '高楼层(共14层)', '低楼层(共14层)', '低楼层(共7层)', '顶层(共7层)',
       '地下室(共6层)', '顶层(共13层)', '低楼层(共12层)', '底层(共13层)', '高楼层(共20层)',
       '低楼层(共24层)', '4层', '1层', '高楼层(共24层)', '中楼层(共21层)', '中楼层(共24层)',
       '高楼层(共19层)', '顶层(共21层)', '底层(共19层)', '底层(共21层)', '高楼层(共8层)',
       '2013年建板楼', '中楼层(共8层)', '中楼层(共25层)', '低楼层(共25层)', '底层(共25层)',
       '低楼层(共26层)', '底层(共24层)', '顶层(共27层)', '高楼层(共22层)', '6层',
       '低楼层(共22层)', '中楼层(共28层)', '中楼层(共27层)', '顶层(共23层)', '中楼层(共26层)',
       '高楼层(共28层)', '低楼层(共27层)', '高楼层(共27层)', '低楼层(共23层)', '底层(共28层)',
       '底层(共26层)', '顶层(共24层)', '低楼层(共28层)', '中楼层(共23层)', '顶层(共10层)',
       '高楼层(共23层)', '2013年建暂无数据', '低楼层(共20层)', '底层(共10层)', '高楼层(共25层)',
       '高楼层(共11层)', '高楼层(共26层)', '低楼层(共21层)', '底层(共20层)', '高楼层(共21层)',
       '中楼层(共19层)', '2011年建板塔结合', '2015年建板楼', '2012年建板楼', '11层',
       '2012年建暂无数据', '低楼层(共19层)', '顶层(共18层)', '2014年建板楼', '2012年建板塔结合',
       '2013年建板塔结合', '中楼层(共29层)', '地下室(共3层)', '顶层(共15层)', '上叠(共5层)',
       '顶层(共20层)', '9层', '下叠(共5层)', '低楼层(共8层)', '2011年建暂无数据', '顶层(共25层)',
       '底层(共8层)', '底层(共7层)', '地下室(共15层)', '2013年建塔楼', '地下室(共7层)',
       '地下室(共10层)', '15层', '下叠(共4层)', '地下室(共2层)', '上叠(共6层)', '地下室(共4层)',
       '上叠(共4层)', '上叠(共3层)', '底层(共22层)', '底层(共17层)', '地下室(共5层)', '8层',
       '中楼层(共22层)', '2009年建暂无数据', '低楼层(共36层)', '中楼层(共36层)', '顶层(共22层)',
       '顶层(共19层)', '7层', '低楼层(共31层)', '中楼层(共31层)', '高楼层(共31层)', '12层',
       '2012年建塔楼', '底层(共27层)', '2008年建板楼', '地下室(共18层)', '中楼层(共30层)',
       '18层', '2014年建塔楼', '2014年建暂无数据', '低楼层(共29层)', '2016年建板塔结合',
       '中楼层(共33层)', '2015年建暂无数据', '高楼层(共29层)', '低楼层(共33层)', '高楼层(共33层)',
       '低楼层(共34层)', '高楼层(共34层)', '顶层(共34层)', '中楼层(共34层)', '底层(共29层)',
       '顶层(共28层)', '低楼层(共30层)', '顶层(共26层)', '底层(共30层)', '高楼层(共30层)',
       '顶层(共29层)', '顶层(共30层)', '地下室(共12层)', '中楼层(共32层)', '高楼层(共32层)',
       '2007年建板塔结合', '低楼层(共32层)', '顶层(共32层)', '底层(共31层)', '2001年建板楼',
       '暂无数据', '19层', '2012年建平房', '平房', '2014年建平房', '2016年建暂无数据', '14层',
       '2008年建板塔结合', '地下室(共8层)', '底层(共32层)', '地下室(共11层)', '2010年建暂无数据',
       '低楼层(共35层)', '低楼层(共40层)', '顶层(共35层)', '中楼层(共35层)', '高楼层(共40层)',
       '高楼层(共35层)', '2011年建板楼', '2005年建板楼', '2007年建板楼', '2010年建板楼',
       '2009年建板楼', '2006年建板楼', '底层(共23层)', '2009年建板塔结合', '2005年建暂无数据',
       '2006年建暂无数据', '2002年建板塔结合', '2004年建暂无数据', '地下室(共9层)', '2006年建塔楼',
       '2008年建暂无数据', '地下室(共14层)', '2014年建板塔结合', '2004年建板楼', '2005年建塔楼',
       '地下室(共16层)', '16层', '低楼层(共63层)', '底层(共33层)', '板楼', '2006年建板塔结合',
       '2007年建暂无数据', '中楼层(共57层)', '高楼层(共57层)', '中楼层(共42层)', '低楼层(共42层)',
       '高楼层(共42层)', '中楼层(共63层)', '27层', '板塔结合', '地下室(共0层)', '2010年建塔楼',
       '2011年建塔楼', '21层', '20层', '25层', '顶层(共33层)', '17层', '2004年建塔楼',
       '底层(共35层)', '底层(共34层)', '顶层(共31层)', '2009年建塔楼', '2008年建塔楼',
       '地下室(共21层)', '地下室(共28层)', '地下室(共1层)', '中楼层(共37层)', '28层',
       '低楼层(共37层)'], dtype=object)
dataset[dataset['type_house']=='地下室(共21层)'][['type_house','years_house']]
| type_house | years_house | |
|---|---|---|
| 469271 | 地下室(共21层) | 1991年建塔楼 |
dataset['years_house'].unique()
array([nan, '2010年建暂无数据', '2012年建暂无数据', '2011年建暂无数据', '2015年建暂无数据',
       '2009年建暂无数据', '2006年建暂无数据', '暂无数据', '2016年建暂无数据', '2004年建暂无数据',
       '2017年建暂无数据', '2014年建暂无数据', '1998年建暂无数据', '2013年建板楼', '2013年建暂无数据',
       '2011年建板楼', '2005年建板楼', '2011年建塔楼', '板楼', '2008年建暂无数据',
       '2001年建暂无数据', '2008年建板楼', '1979年建板楼', '2015年建板楼', '2004年建板楼',
       '1992年建板楼', '1985年建暂无数据', '1997年建板楼', '2002年建板楼', '1996年建暂无数据',
       '2006年建板楼', '2015年建塔楼', '2012年建板楼', '2003年建暂无数据', '1986年建板楼',
       '1995年建板楼', '1986年建暂无数据', '2010年建板楼', '1981年建暂无数据', '1993年建板楼',
       '1989年建板楼', '1995年建板塔结合', '2003年建板楼', '1998年建板楼', '2007年建板楼',
       '2007年建暂无数据', '1997年建暂无数据', '2014年建板楼', '2016年建板楼', '1999年建板楼',
       '2001年建板楼', '2000年建板楼', '1996年建板楼', '2005年建板塔结合', '1987年建板楼',
       '2006年建塔楼', '2006年建板塔结合', '1970年建板楼', '1990年建板楼', '1980年建板楼',
       '1982年建板楼', '1994年建板楼', '1983年建板楼', '1985年建板楼', '1991年建板楼',
       '1988年建板楼', '2003年建塔楼', '2009年建板楼', '1981年建板楼', '2017年建板楼',
       '2016年建板塔结合', '2015年建板塔结合', '1958年建暂无数据', '1975年建板楼', '1984年建板楼',
       '1966年建板楼', '2013年建板塔结合', '2013年建塔楼', '1988年建塔楼', '1980年建塔楼',
       '2001年建塔楼', '2010年建板塔结合', '2016年建塔楼', '2012年建塔楼', '2005年建暂无数据',
       '2017年建塔楼', '2012年建板塔结合', '2009年建板塔结合', '2014年建塔楼', '2014年建板塔结合',
       '1999年建暂无数据', '2007年建板塔结合', '2008年建板塔结合', '2010年建塔楼', '2011年建板塔结合',
       '板塔结合', '2007年建塔楼', '2009年建塔楼', '2004年建板塔结合', '2000年建暂无数据',
       '2008年建塔楼', '1995年建暂无数据', '2003年建板塔结合', '1988年建暂无数据', '2002年建暂无数据',
       '1992年建暂无数据', '1989年建暂无数据', '2000年建板塔结合', '1994年建塔楼', '1979年建暂无数据',
       '1980年建暂无数据', '1984年建暂无数据', '2001年建板塔结合', '1994年建暂无数据',
       '2002年建板塔结合', '1977年建板楼', '1975年建暂无数据', '1976年建板楼', '2004年建塔楼',
       '1978年建暂无数据', '1976年建暂无数据', '1993年建暂无数据', '2002年建塔楼', '1996年建塔楼',
       '1986年建塔楼', '1994年建板塔结合', '1991年建板塔结合', '2000年建塔楼', '1999年建塔楼',
       '1999年建板塔结合', '塔楼', '1997年建塔楼', '1978年建板楼', '2005年建塔楼', '1960年建板楼',
       '1998年建塔楼', '1995年建塔楼', '1998年建板塔结合', '1962年建板楼', '1996年建板塔结合',
       '1990年建暂无数据', '1960年建暂无数据', '1982年建暂无数据', '1990年建板塔结合',
       '1997年建板塔结合', '1992年建塔楼', '1964年建板楼', '1958年建板楼', '1973年建板楼',
       '1983年建塔楼', '1985年建塔楼', '1987年建塔楼', '1974年建板楼', '1984年建塔楼',
       '1989年建板塔结合', '1990年建塔楼', '1991年建塔楼', '1987年建暂无数据', '1950年建板楼',
       '1989年建塔楼', '1993年建塔楼', '1963年建板楼', '1992年建板塔结合', '1988年建板塔结合',
       '1984年建板塔结合', '1985年建板塔结合', '1993年建板塔结合', '1983年建板塔结合',
       '1987年建板塔结合', '1986年建板塔结合', '1956年建板楼', '1954年建板楼', '1957年建板楼',
       '1955年建板楼', '1968年建板楼', '1978年建板塔结合', '1959年建板楼', '1965年建板楼',
       '1995年建平房', '1980年建板塔结合', '1982年建板塔结合', '1967年建板楼', '1982年建塔楼',
       '1963年建板塔结合', '1970年建板塔结合', '1981年建塔楼', '1980年建平房', '1961年建板楼',
       '1950年建暂无数据', '1979年建塔楼', '1972年建板楼', '1981年建板塔结合', '1991年建暂无数据',
       '1979年建板塔结合', '1971年建板楼', '1952年建板楼', '1953年建板楼', '1969年建板楼',
       '1977年建板塔结合', '1970年建暂无数据'], dtype=object)
dataset.info()
<class 'pandas.core.frame.DataFrame'>
RangeIndex: 474301 entries, 0 to 474300
Data columns (total 39 columns):
introduction_house               474301 non-null object
community_house                  474301 non-null object
href_house                       474301 non-null object
unit_house                       38137 non-null object
size_house                       38137 non-null object
direction_house                  38137 non-null object
decoration_house                 38109 non-null object
elevator_house                   37093 non-null object
type_house                       38137 non-null object
years_house                      38100 non-null object
area_house                       474301 non-null object
interests_house                  38137 non-null object
watch_times                      38137 non-null object
submit_period                    38137 non-null object
years_period                     30543 non-null object
tax_free                         35260 non-null object
total_price                      474301 non-null float64
smeter_price                     474301 non-null object
region                           474301 non-null object
info_cluster                     436164 non-null object
info_flood                       436164 non-null object
info_follow                      436164 non-null object
years_house_year_edit1           37850 non-null float64
size_house_edit1                 474301 non-null float64
size_house_edit1_addcata         474301 non-null object
watch_time_edit1                 474301 non-null int64
watch_time_edit1_addcata         474301 non-null object
interests_house_edit1            474301 non-null int64
interests_house_edit1_addcata    474301 non-null object
submit_period_edit1              474301 non-null int64
submit_period_edit1_addcata      474301 non-null object
years_period_edit1               474301 non-null object
tax_free_edit1                   474301 non-null object
smeter_price_edit1               474301 non-null int64
direction_edit1                  474301 non-null object
decoration_edit1                 474301 non-null object
elevator_edit1                   474301 non-null object
type_house_edit1                 474301 non-null object
years_house_type_edit1           474301 non-null object
dtypes: float64(3), int64(4), object(32)
memory usage: 141.1+ MB
dataset.columns
Index(['introduction_house', 'community_house', 'href_house', 'unit_house',
       'size_house', 'direction_house', 'decoration_house', 'elevator_house',
       'type_house', 'years_house', 'area_house', 'interests_house',
       'watch_times', 'submit_period', 'years_period', 'tax_free',
       'total_price', 'smeter_price', 'region', 'info_cluster', 'info_flood',
       'info_follow', 'years_house_year_edit1', 'size_house_edit1',
       'size_house_edit1_addcata', 'watch_time_edit1',
       'watch_time_edit1_addcata', 'interests_house_edit1',
       'interests_house_edit1_addcata', 'submit_period_edit1',
       'submit_period_edit1_addcata', 'years_period_edit1', 'tax_free_edit1',
       'smeter_price_edit1', 'direction_edit1', 'decoration_edit1',
       'elevator_edit1', 'type_house_edit1', 'years_house_type_edit1'],
      dtype='object')
feature1 = ['community_house','unit_house','size_house_edit1','size_house_edit1_addcata','watch_time_edit1','watch_time_edit1_addcata','interests_house_edit1','interests_house_edit1_addcata','submit_period_edit1','submit_period_edit1_addcata','years_period_edit1','tax_free_edit1','total_price','smeter_price_edit1',
            'direction_edit1','decoration_edit1','elevator_edit1','type_house_edit1','years_house_type_edit1','years_house_year_edit1','region']
dataset_used1 = dataset[feature1]
dataset['region'].unique()
array(['cd', 'xm', 'sh', 'sz', 'zz', 'qd', 'su', 'cq', 'dl', 'hf', 'sjz',
       'cs', 'wh', 'nj', 'hz', 'tj', 'gz', 'bj', 'lf', 'jn', 'fs', 'zh',
       'zs'], dtype=object)
dataset_used1.head()
| community_house | unit_house | size_house_edit1 | size_house_edit1_addcata | watch_time_edit1 | watch_time_edit1_addcata | interests_house_edit1 | interests_house_edit1_addcata | submit_period_edit1 | submit_period_edit1_addcata | years_period_edit1 | tax_free_edit1 | total_price | smeter_price_edit1 | direction_edit1 | decoration_edit1 | elevator_edit1 | type_house_edit1 | years_house_type_edit1 | years_house_year_edit1 | region | |
|---|---|---|---|---|---|---|---|---|---|---|---|---|---|---|---|---|---|---|---|---|---|
| 0 | 麓山国际帕萨迪纳3组 | NaN | 98.070 | 0 | -1 | 1 | -1 | 1 | -1 | 2 | 0 | 0 | 250.000 | 25492 | nodata | nodata | 有电梯 | nodata | nodata | nan | cd |
| 1 | 麓山国际塞尔维蒙 | NaN | 206.000 | 0 | -1 | 1 | -1 | 1 | -1 | 2 | 0 | 0 | 420.000 | 20389 | nodata | nodata | 无电梯 | nodata | nodata | nan | cd |
| 2 | 麓山国际半月湾 | NaN | 112.190 | 0 | -1 | 1 | -1 | 1 | -1 | 2 | 0 | 0 | 275.000 | 24512 | nodata | 其他 | nodata | nodata | nodata | nan | cd |
| 3 | 心怡中丝园 | NaN | 87.560 | 0 | -1 | 1 | -1 | 1 | -1 | 2 | 0 | 0 | 193.000 | 22043 | nodata | nodata | 有电梯 | nodata | nodata | nan | cd |
| 4 | 麓山国际茵特拉肯A | NaN | 128.740 | 0 | -1 | 1 | -1 | 1 | -1 | 2 | 0 | 0 | 300.000 | 23303 | nodata | 其他 | nodata | nodata | nodata | nan | cd |
dataset_used1.info()
<class 'pandas.core.frame.DataFrame'>
RangeIndex: 474301 entries, 0 to 474300
Data columns (total 21 columns):
community_house                  474301 non-null object
unit_house                       38137 non-null object
size_house_edit1                 474301 non-null float64
size_house_edit1_addcata         474301 non-null object
watch_time_edit1                 474301 non-null int64
watch_time_edit1_addcata         474301 non-null object
interests_house_edit1            474301 non-null int64
interests_house_edit1_addcata    474301 non-null object
submit_period_edit1              474301 non-null int64
submit_period_edit1_addcata      474301 non-null object
years_period_edit1               474301 non-null object
tax_free_edit1                   474301 non-null object
total_price                      474301 non-null float64
smeter_price_edit1               474301 non-null int64
direction_edit1                  474301 non-null object
decoration_edit1                 474301 non-null object
elevator_edit1                   474301 non-null object
type_house_edit1                 474301 non-null object
years_house_type_edit1           474301 non-null object
years_house_year_edit1           37850 non-null float64
region                           474301 non-null object
dtypes: float64(3), int64(4), object(14)
memory usage: 76.0+ MB
绘图分析
# # 绘图
# fig, ax = plt.subplots()
# ax.scatter(x = dataset['GrLivArea'], y = dataset['total_price'])
# plt.ylabel('total_price', fontsize=13)
# plt.xlabel('GrLivArea', fontsize=13)
# plt.show()
单变量观察
yjiu = ['community_house','unit_house','size_house_edit1','size_house_edit1_addcata','watch_time_edit1','watch_time_edit1_addcata','interests_house_edit1','interests_house_edit1_addcata','submit_period_edit1','submit_period_edit1_addcata','years_period_edit1','tax_free_edit1','total_price','smeter_price_edit1','direction_edit1','decoration_edit1','elevator_edit1','type_house_edit1','years_house_type_edit1','years_house_year_edit1']
print(yjiu)
['community_house', 'unit_house', 'size_house_edit1', 'size_house_edit1_addcata', 'watch_time_edit1', 'watch_time_edit1_addcata', 'interests_house_edit1', 'interests_house_edit1_addcata', 'submit_period_edit1', 'submit_period_edit1_addcata', 'years_period_edit1', 'tax_free_edit1', 'total_price', 'smeter_price_edit1', 'direction_edit1', 'decoration_edit1', 'elevator_edit1', 'type_house_edit1', 'years_house_type_edit1', 'years_house_year_edit1']
面积、查看次数、收藏次数、发布时间
房屋面积:size_house_edit1_addcata
查看次数:watch_time_edit1_addcata
感兴趣人数:interests_house_edit1_addcata
多久前发布:submit_period_edit1_addcata
fig1 = plt.figure(figsize=(10,10))
fig1.add_subplot(221)
fg1 = sns.distplot(dataset_used1[dataset_used1['size_house_edit1_addcata']=='0']['size_house_edit1'],bins=1000,kde=False,color='b')
fg1.set(xlim=(0,500))
plt.title('size')

fig1.add_subplot(222)
fg2 = sns.distplot(dataset_used1[dataset_used1['watch_time_edit1_addcata']=='0']['watch_time_edit1'],bins=500,kde=False,color='b')
fg2.set(xlim=(0,50))
plt.title('watch_time')

fig1.add_subplot(223)
fg3 = sns.distplot(dataset_used1[dataset_used1['interests_house_edit1_addcata']=='0']['interests_house_edit1'],bins=1000,kde=False,color='b')
fg3.set(xlim=(0,500))
plt.title('interests_house')

fig1.add_subplot(224)
fg4 = sns.distplot(dataset_used1[dataset_used1['submit_period_edit1_addcata']=='0']['submit_period_edit1'],bins=200,kde=False,color='b')
fg4.set(xlim=(0,100))
plt.title('submit_period_edit1')
Text(0.5,1,'submit_period_edit1')
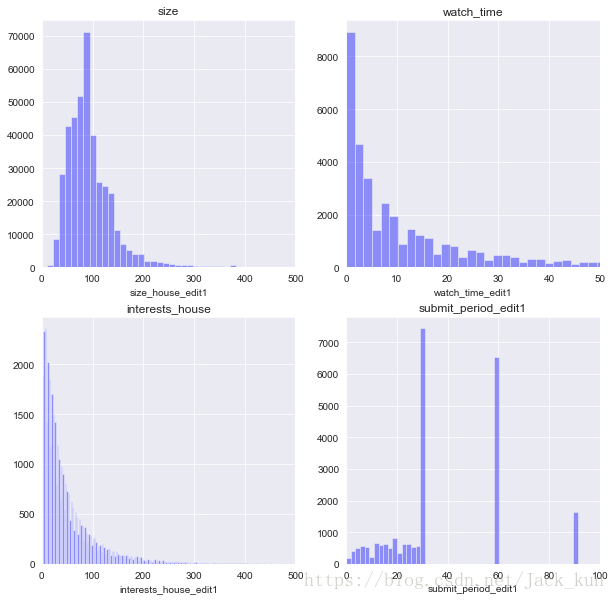
从上面的结果观察,size的分布呈现偏右整体分布;watch_times和interest_house呈现由小到大下降的分布;submit_period呈现非均匀分布状态,发现>30天以上的数量明显要多很多。
2年产权、5年产权、房屋户型
产权是满足5年:tax_free_edit1
产权是否满2年:years_period_edit1
房屋户型:unit_house
fig2_1 = plt.figure(figsize=(10,6))
ax3 = fig2_1.add_subplot(221)

dataset_used1['tax_free_edit1'].value_counts().plot(kind='bar')
plt.title('tax_free')

ax2 = fig2_1.add_subplot(222)
dataset_used1['years_period_edit1'].value_counts().plot(kind='bar')
plt.title('years_period')

ax1 = fig2_1.add_subplot(212)
ax1.margins(0.05)           # Default margin is 0.05, value 0 means fit

dataset_used1['unit_house'].value_counts().plot(kind='bar')
plt.title('unit_house')
Text(0.5,1,'unit_house')
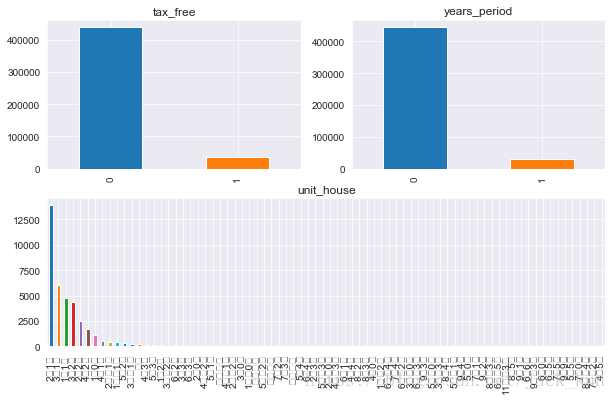
观察到2年产权大多数不满足,5年产权的情况类似;房屋类型主要以2室1厅、3室1厅、1室1厅,3室2厅、2室2厅、4室2厅为主。
dataset_used1['unit_house'].value_counts().head(10)
2室1厅     13889
3室1厅      6080
1室1厅      4770
3室2厅      4339
2室2厅      2524
4室2厅      1670
1室0厅      1105
4室1厅       492
2房间1卫      443
1房间1卫      438
Name: unit_house, dtype: int64
从上面结果观察到,2年、5年产权中,没有产权的占比最大,户型类别当中,集中在前十种类型,其中2室1厅占主要
fig2 = plt.figure(figsize=(6,6))
fig2.add_subplot(111)
fg1 = sns.distplot(dataset_used1['total_price'],bins=1500,kde=False,color='b')
fg1.set(xlim=(0,2000))
plt.title('total_price')
Text(0.5,1,'total_price')
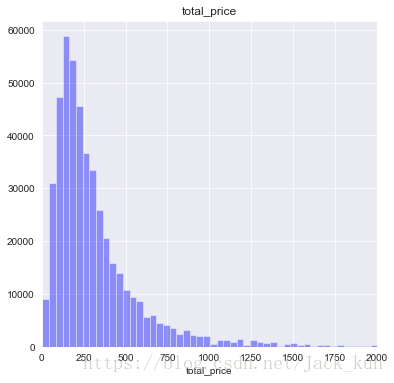
从总价钱的分布当中观察,total_price呈现偏右正态分布。
朝向、装修程度、电梯配备、楼层位置、楼型、建成时间
'direction_edit1', 'decoration_edit1', 'elevator_edit1', 'type_house_edit1', 'years_house_type_edit1', 'years_house_year_edit1'
('direction_edit1',
 'decoration_edit1',
 'elevator_edit1',
 'type_house_edit1',
 'years_house_type_edit1',
 'years_house_year_edit1')
# 朝向类别——过多不好绘图
dataset_used1['direction_edit1'].unique()
array(['nodata', ' 东 南 西 北', ' 南', ' 南 北', ' 北', ' 西南', ' 东南', ' 东 南',
       ' 东', ' 西北', ' 西', ' 南 西', ' 东北', ' 东南 西北', ' 东 东南', '南 北', '东南',
       '东 南 西 北', '东 东南 南 西南 西', '东 南 北', '南', '东 西', '东南 西北', '东 南', '西',
       '东 西 北', '东北', '东南 南 北', '南 西 北', '西北', '东 南 西', '东 北', '北', '西南',
       '东南 北', '东', '南 西', '西 北', '东南 西南', '西南 北', '南 西北', '东南 西', '东 西北',
       '南 西南', '南 西南 北', '南 西北 北', '东 北 东北', '东 西 东北', '南 北 东北',
       '东 东南 南 北', '东南 西 北', '西南 东北', '东南 东北', '东 东南', '南 北 西', '东南 南',
       '东南 南 西南', '西 东北', '南 东', '北 东北', '南 北 东', '西北 北', '南 东北', '西南 西',
       '南 东 北', '东南 西南 西北', '东 西南', '西 西北', '西 西北 北', ' 东 西', '南 西 东北',
       '东 西北 北', '南 西南 东北', '西 东', '北 西南', '西南 西北', '东 东南 西北 北',
       '东南 南 东北', '东南 南 西北', '南 西 西北', '东 西 北 东北', '南 西南 西 西北 东北',
       '西南 西北 东北', '西北 北 东北', '东南 西南 北', '东 南 西北', '西 西南', '东 东北',
       '东南 西北 北', '西北 东北', '北 西', '东 西 西北', '北 东', '东 东南 南', '北 南',
       '东南 西南 东北', '西南 西 北', '东 西南 东北', '东南 西北 东北', '东 西南 西', '南 西南 西',
       '东 西南 北'], dtype=object)
# 装饰
dataset_used1['decoration_edit1'].unique()
array(['nodata', '其他', '毛坯', '精装', '简装'], dtype=object)
dataset_used1['elevator_edit1'].unique()
array(['有电梯', '无电梯', 'nodata'], dtype=object)
dataset_used1['type_house_edit1'].unique()
array(['nodata', '低楼层', '顶层', '底层', '高楼层', '中楼层', '地下室', '上叠', '下叠'],
      dtype=object)
dataset_used1['years_house_type_edit1'].unique()
array(['nodata', '板', '塔', '板塔', '别墅', '平房'], dtype=object)
fig3 = plt.figure(figsize=(10,10))
fig3.add_subplot(221)
dataset_used1['decoration_edit1'].value_counts().plot(kind='bar')
plt.title('decoration_edit1')

fig3.add_subplot(222)
dataset_used1['elevator_edit1'].value_counts().plot(kind='bar')
plt.title('elevator_edit1')

fig3.add_subplot(223)
dataset_used1['type_house_edit1'].value_counts().plot(kind='bar')
plt.title('type_house_edit1')

fig3.add_subplot(224)
dataset_used1['years_house_type_edit1'].value_counts().plot(kind='bar')
plt.title('years_house_type_edit1')
plt.rcParams['font.sans-serif'] = ['SimHei']
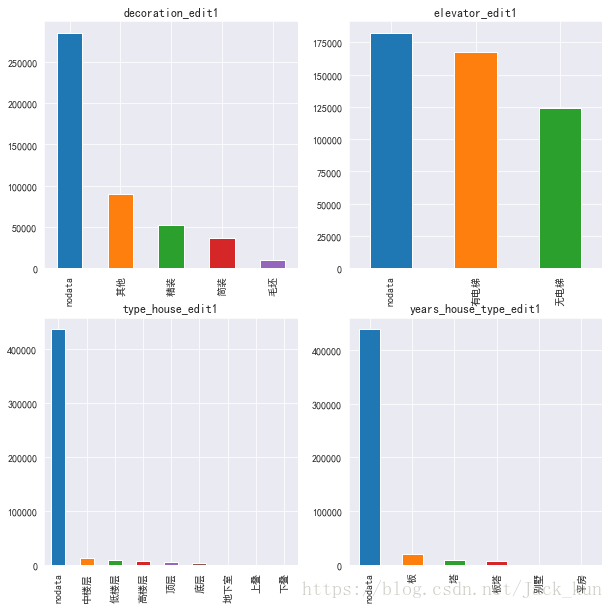
对有数据的情况观察:
装修以精装>简装>毛坯;
电梯:有>无
楼层前3:中楼层>低楼层>高楼层
楼类型前3:板>塔>板塔
fig31 = plt.figure(figsize=(10,6))
fig31.add_subplot(111)
dataset_used1['years_house_year_edit1'].value_counts().plot(kind='bar')
plt.title('years_house_year_edit1')
Text(0.5,1,'years_house_year_edit1')

从房屋建造年代看,以2010年建造的为主,其中2003-2005三年最多。
多维度分析
产权和查看次数、收藏次数
2年产权的查看次数、收藏次数
5年产权的产看次数、收藏次数
2室1厅户型的具有2年产权查看次数
2室1厅户型的具有5年产权查看次数
产权是满足5年:tax_free_edit1
产权是否满2年:years_period_edit1
房屋户型:unit_house
收藏次数watch_time_edit1 感兴趣人数:interests_house_edit1
cond_dataset1 = dataset_used1[dataset_used1['years_period_edit1']=='0']['watch_time_edit1'].value_counts()
fig42 = plt.figure(figsize=(12,12))
fig42.add_subplot(221)
fg1 = sns.distplot(cond_dataset1[1:],bins=200,kde=False,color='b')
fg1.set(xlim=(0,400))
plt.title('产权是满2年的收藏次数')

cond_dataset2 = dataset_used1[dataset_used1['years_period_edit1']=='0']['interests_house_edit1'].value_counts()
fig42.add_subplot(222)
fg1 = sns.distplot(cond_dataset2[1:],bins=200,kde=False,color='b')
fg1.set(xlim=(0,200))
plt.title('产权是满2年的感兴趣人数')

cond_dataset3 = dataset_used1[dataset_used1['tax_free_edit1']=='0']['watch_time_edit1'].value_counts()
fig42.add_subplot(223)
fg1 = sns.distplot(cond_dataset1[1:],bins=200,kde=False,color='b')
fg1.set(xlim=(0,400))
plt.title('产权是满5年的收藏次数')

cond_dataset4 = dataset_used1[dataset_used1['tax_free_edit1']=='0']['interests_house_edit1'].value_counts()
fig42.add_subplot(224)
fg1 = sns.distplot(cond_dataset2[1:],bins=200,kde=False,color='b')
fg1.set(xlim=(0,200))
plt.title('产权是满5年的感兴趣人数')
Text(0.5,1,'产权是满5年的感兴趣人数')
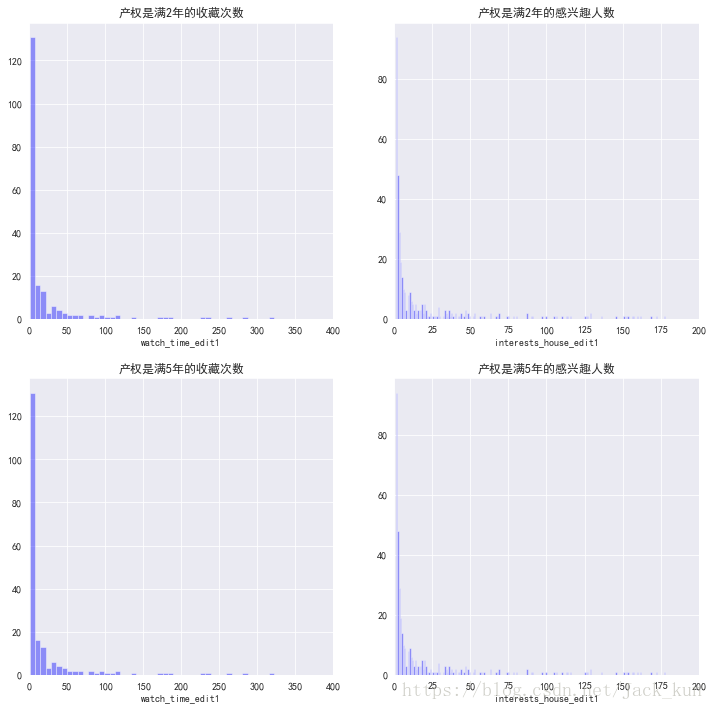
从上面结果来看,对于产权在2年和5年,收藏次数和关注人数分布以10次以下群体为主。呈现明显偏右分布。
户型+产权和查看次数、收藏次数
cond_dataset1 = dataset_used1[(dataset_used1['unit_house']=='2室1厅')&(dataset_used1['years_period_edit1']=='0')]['watch_time_edit1'].value_counts()
fig42 = plt.figure(figsize=(16,8))
fig42.add_subplot(121)
fg1 = sns.barplot(x=cond_dataset1[1:].index, y=cond_dataset1[1:].values)
# fg1.set(xlim=(0,400))
plt.title('产权是满2年的收藏次数')

cond_dataset2 = dataset_used1[(dataset_used1['unit_house']=='2室1厅')&(dataset_used1['years_period_edit1']=='0')]['interests_house_edit1'].value_counts()
fig42.add_subplot(122)
fg1 = sns.barplot(x=cond_dataset2[1:].index, y=cond_dataset2[1:].values)
# fg1.set(xlim=(0,200))
plt.title('产权是满2年的感兴趣人数')
Text(0.5,1,'产权是满2年的感兴趣人数')
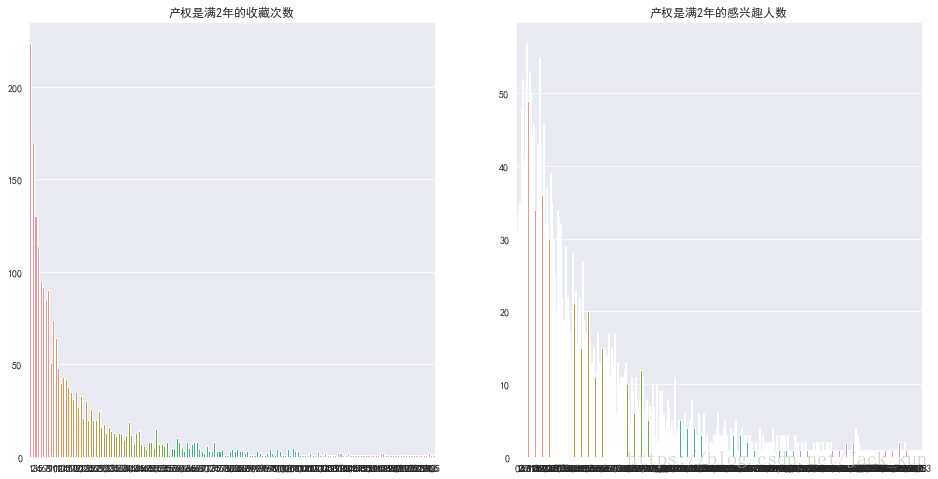
从多条件看,在2室一厅的房型中,2年产权的收藏次数和关注人数均呈现逐渐偏右分布。
dataset_used1['unit_house'].unique()
array([nan, '4室2厅', '3室2厅', '5室3厅', '2室1厅', '6室2厅', '9室9厅', '2室2厅',
       '4室1厅', '3室1厅', '5室2厅', '1室1厅', '3室3厅', '7室4厅', '4室3厅', '6室4厅',
       '7室3厅', '7室2厅', '5室4厅', '5室1厅', '1室0厅', '2室0厅', '1室2厅', '车位',
       '3房间1卫', '6房间2卫', '联排别墅', '2房间1卫', '1房间1卫', '5房间2卫', '2房间2卫',
       '2房间0卫', '1房间0卫', '6室3厅', '3房间0卫', '3房间2卫', '叠拼别墅', '4房间1卫',
       '4室4厅', '4房间2卫', '3室0厅', '4室0厅', '独栋别墅', '8室3厅', '双拼别墅', '8室2厅',
       '2室3厅', '9室2厅', '4室5厅', '5房间3卫', '4房间3卫', '11房间3卫', '6房间4卫',
       '6房间3卫', '9室1厅', '5房间1卫', '6室1厅', '8室4厅', '9房间3卫', '9室3厅', '5房间0卫',
       '6室0厅', '7房间2卫', '5室0厅', '8室5厅', '9室4厅', '7室5厅', '3房间3卫', '1房间2卫',
       '8房间4卫', '8房间3卫', '7室0厅', '5室5厅', '7室1厅', '6室5厅', '6室6厅', '6房间5卫'],
      dtype=object)
cond = (dataset_used1['years_period_edit1']=='1')&(dataset_used1['unit_house']=='2室1厅')

dataset_used1[cond][['interests_house_edit1','watch_time_edit1']].head()
| interests_house_edit1 | watch_time_edit1 | |
|---|---|---|
| 337734 | 32 | 0 |
| 342189 | 103 | 8 |
| 342194 | 55 | 2 |
| 342207 | 38 | 4 |
| 342210 | 1 | 0 |
dataset_used1['years_house_type_edit1'].unique()
array(['nodata', '板', '塔', '板塔', '别墅', '平房'], dtype=object)
dataset_used1.ix[337734,:]
community_house                  龙湖长城源著
unit_house                          2室1厅
size_house_edit1                   0.000
size_house_edit1_addcata               1
watch_time_edit1                       0
watch_time_edit1_addcata               0
interests_house_edit1                 32
interests_house_edit1_addcata          0
submit_period_edit1                   29
submit_period_edit1_addcata            0
years_period_edit1                     1
tax_free_edit1                         1
total_price                      235.000
smeter_price_edit1                 28266
direction_edit1                       东南
decoration_edit1                      其他
elevator_edit1                    nodata
type_house_edit1                     低楼层
years_house_type_edit1            nodata
years_house_year_edit1          2015.000
region                                bj
Name: 337734, dtype: object
dataset_used1['region'].unique()
array(['cd', 'xm', 'sh', 'sz', 'zz', 'qd', 'su', 'cq', 'dl', 'hf', 'sjz',
       'cs', 'wh', 'nj', 'hz', 'tj', 'gz', 'bj', 'lf', 'jn', 'fs', 'zh',
       'zs'], dtype=object)
关联分析
目标变量,房子单价,smeter_price_edit1。
不同的面积-单价,size_house_edit1
不同地区-单价,region
2年产权-单价,years_period_edit1
5年产权-单价,tax_free_edit1
不同户型-单价,unit_house
** 不同查看次数-单价,watch_time_edit1**
** 不同收藏次数-单价,interests_house_edit1**
不同装修程度-单价,decoration_edit1
** 不同朝向-单价,direction_edit1**
不同电梯配置-单价,elevator_edit1
不同楼层位置-单价,type_house_edit1
不同楼型-单价,years_house_type_edit1
不同建成时间-单价,years_house_year_edit1
** 不同小区-单价**
dataset_used1.groupby('years_period_edit1')['smeter_price_edit1'].mean()
years_period_edit1
0   31620.411
1   64924.182
Name: smeter_price_edit1, dtype: float64
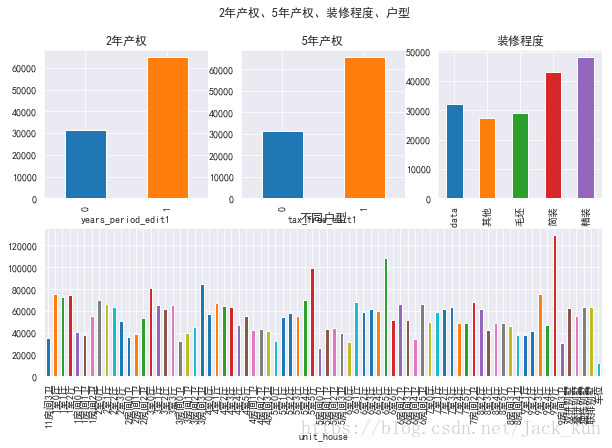
2年产权、5年产权vs装修程度、户型
fig5 = plt.figure(figsize=(10,6))
fig5.suptitle('2年产权、5年产权、装修程度、户型')
fig5.add_subplot(231)
dataset_used1.groupby('years_period_edit1')['smeter_price_edit1'].mean().plot(kind='bar')
plt.title('2年产权')

fig5.add_subplot(232)
dataset_used1.groupby('tax_free_edit1')['smeter_price_edit1'].mean().plot(kind='bar')
plt.title('5年产权')

fig5.add_subplot(233)
dataset_used1.groupby('decoration_edit1')['smeter_price_edit1'].mean().plot(kind='bar')
plt.title('装修程度')

fig5.add_subplot(212)
dataset_used1.groupby('unit_house')['smeter_price_edit1'].mean().plot(kind='bar')
plt.title('不同户型')
Text(0.5,1,'不同户型')
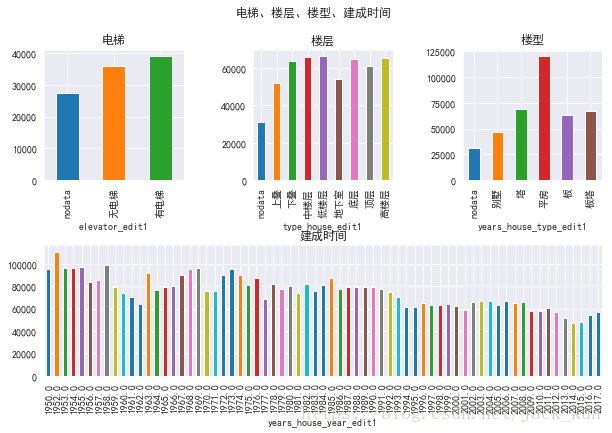
电梯、楼层、楼型、建成时间单变量统计
fig5 = plt.figure(figsize=(10,6))
# plt.tight_layout(pad=1)
fig5.suptitle('电梯、楼层、楼型、建成时间')

plt.subplots_adjust(wspace=0.5,hspace=0.5)
fig5.add_subplot(231)
dataset_used1.groupby('elevator_edit1')['smeter_price_edit1'].mean().plot(kind='bar')
plt.title('电梯')

fig5.add_subplot(232)
dataset_used1.groupby('type_house_edit1')['smeter_price_edit1'].mean().plot(kind='bar')
plt.title('楼层')

fig5.add_subplot(233)
dataset_used1.groupby('years_house_type_edit1')['smeter_price_edit1'].mean().plot(kind='bar')
plt.title('楼型')

fig5.add_subplot(212)
dataset_used1.groupby('years_house_year_edit1')['smeter_price_edit1'].mean().plot(kind='bar')
plt.title('建成时间')
Text(0.5,1,'建成时间')
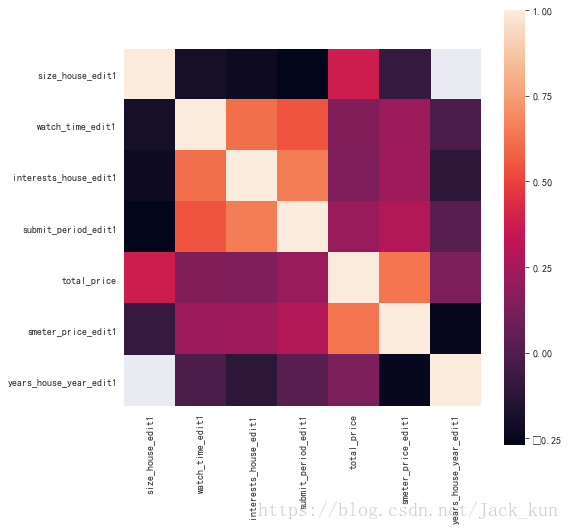
连续变量的相关性
dataset_used1.corr()
| size_house_edit1 | watch_time_edit1 | interests_house_edit1 | submit_period_edit1 | total_price | smeter_price_edit1 | years_house_year_edit1 | |
|---|---|---|---|---|---|---|---|
| size_house_edit1 | 1.000 | -0.193 | -0.225 | -0.269 | 0.373 | -0.087 | nan |
| watch_time_edit1 | -0.193 | 1.000 | 0.617 | 0.544 | 0.147 | 0.225 | -0.017 |
| interests_house_edit1 | -0.225 | 0.617 | 1.000 | 0.651 | 0.138 | 0.235 | -0.118 |
| submit_period_edit1 | -0.269 | 0.544 | 0.651 | 1.000 | 0.217 | 0.287 | 0.026 |
| total_price | 0.373 | 0.147 | 0.138 | 0.217 | 1.000 | 0.635 | 0.134 |
| smeter_price_edit1 | -0.087 | 0.225 | 0.235 | 0.287 | 0.635 | 1.000 | -0.250 |
| years_house_year_edit1 | nan | -0.017 | -0.118 | 0.026 | 0.134 | -0.250 | 1.000 |
plt.subplots(figsize=(8,8))
sns.heatmap(dataset_used1.corr(), vmax=1.0, square=True)
<matplotlib.axes._subplots.AxesSubplot at 0x41616358>
异常值检查(size_house_edit1与smeter_price_edit1关系为例)
检查
fig, ax = plt.subplots()
ax.scatter(x = dataset_used1.ix[:, 'size_house_edit1'], y = dataset_used1.ix[:, 'smeter_price_edit1'])
plt.ylabel('SalePrice', fontsize=13)
plt.xlabel('GrLivArea', fontsize=13)
plt.show()
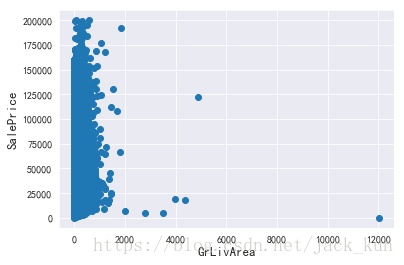
- 从上面的散点图可看出:右下方的几个数据,living area特别大,但是价格又低的离谱,应该是远离市区的无人地带。对最后的分类结果没有影响的离群点(Oultliers),我们可以放心将其删除。
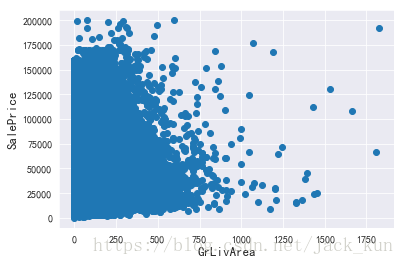
剔除异常点
# 删除离群点
dataset_used1 = dataset_used1.drop(dataset_used1[(dataset_used1['size_house_edit1']>1900) & (dataset_used1['smeter_price_edit1']<1250000)].index)

fig, ax = plt.subplots()
ax.scatter(x = dataset_used1.ix[:, 'size_house_edit1'], y = dataset_used1.ix[:, 'smeter_price_edit1'])
plt.ylabel('SalePrice', fontsize=13)
plt.xlabel('GrLivArea', fontsize=13)
plt.show()
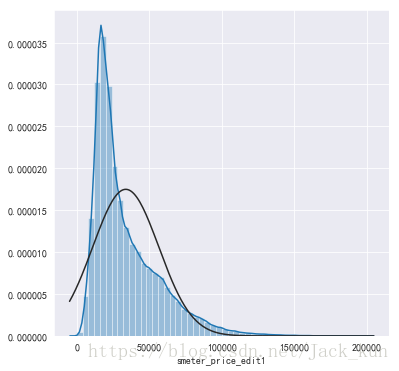
目标变量处理——满足整体分布
- 目标值处理:
- 线性的模型需要正态分布的目标值才能发挥最大的作用。我们需要检测房价什么时候偏离正态分布。使用probplot函数,即正态概率图:
绘制正态分布图
fig5 = plt.figure(figsize=(6,6))

sns.distplot(dataset_used1['smeter_price_edit1'] , fit=norm)
# 正态分布拟合
(mu, sigma) = norm.fit(dataset_used1['smeter_price_edit1'])
print( '\n mu = {:.2f} and sigma = {:.2f}\n'.format(mu, sigma))
mu = 33765.16 and sigma = 22811.23
绘制QQ图
看是否与理论的一致
fig5 = plt.figure(figsize=(6,6))

# 绘图
plt.legend(['Normal dist. ($\mu=$ {:.2f} and $\sigma=$ {:.2f} )'.format(mu, sigma)],
            loc='best')
plt.ylabel('Frequency')
plt.title('SalePrice distribution')

# 原始数据分布绘图
res = stats.probplot(dataset_used1['smeter_price_edit1'], plot=plt)
plt.show()
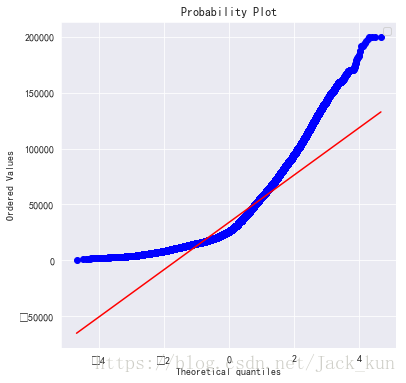
从上图结果观察到,与理论分布偏离较大,需要对其进行转换处理,常见的方法可考虑log变换
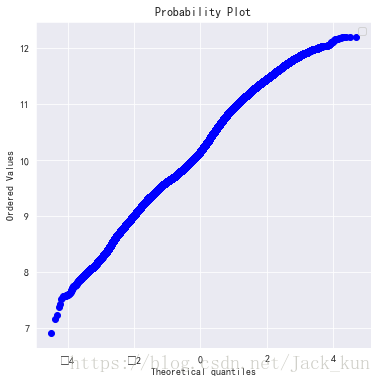
变换处理与查看
# 使用log1p函数完成log(1+x)变换
dataset_used1['smeter_price_edit1'] = np.log1p(dataset_used1['smeter_price_edit1'])
C:\ProgramData\Miniconda3\lib\site-packages\ipykernel_launcher.py:2: RuntimeWarning: divide by zero encountered in log1p
# sns.distplot(dataset_used1['smeter_price_edit1'] , fit=norm)
# 正态分布拟合
(mu, sigma) = norm.fit(dataset_used1['smeter_price_edit1'])
fig6 = plt.figure(figsize=(6,6))

# 绘图
plt.legend(['Normal dist. ($\mu=$ {:.2f} and $\sigma=$ {:.2f} )'.format(mu, sigma)],
            loc='best')
plt.ylabel('Frequency')
plt.title('SalePrice distribution')

# log变换之后的数据分布绘图
res = stats.probplot(dataset_used1['smeter_price_edit1'], plot=plt)
plt.show()
C:\ProgramData\Miniconda3\lib\site-packages\numpy\lib\function_base.py:2320: RuntimeWarning: invalid value encountered in subtract
  X -= avg[:, None]
C:\ProgramData\Miniconda3\lib\site-packages\scipy\stats\_distn_infrastructure.py:879: RuntimeWarning: invalid value encountered in greater
  return (self.a < x) & (x < self.b)
C:\ProgramData\Miniconda3\lib\site-packages\scipy\stats\_distn_infrastructure.py:879: RuntimeWarning: invalid value encountered in less
  return (self.a < x) & (x < self.b)
C:\ProgramData\Miniconda3\lib\site-packages\scipy\stats\_distn_infrastructure.py:1821: RuntimeWarning: invalid value encountered in less_equal
  cond2 = cond0 & (x <= self.a)
缺失值处理
dataset_used1.info()
<class 'pandas.core.frame.DataFrame'>
Int64Index: 474294 entries, 0 to 474300
Data columns (total 21 columns):
community_house                  474294 non-null object
unit_house                       38137 non-null object
size_house_edit1                 474294 non-null float64
size_house_edit1_addcata         474294 non-null object
watch_time_edit1                 474294 non-null int64
watch_time_edit1_addcata         474294 non-null object
interests_house_edit1            474294 non-null int64
interests_house_edit1_addcata    474294 non-null object
submit_period_edit1              474294 non-null int64
submit_period_edit1_addcata      474294 non-null object
years_period_edit1               474294 non-null object
tax_free_edit1                   474294 non-null object
total_price                      474294 non-null float64
smeter_price_edit1               474294 non-null float64
direction_edit1                  474294 non-null object
decoration_edit1                 474294 non-null object
elevator_edit1                   474294 non-null object
type_house_edit1                 474294 non-null object
years_house_type_edit1           474294 non-null object
years_house_year_edit1           37850 non-null float64
region                           474294 non-null object
dtypes: float64(4), int64(3), object(14)
memory usage: 79.6+ MB
# temp1_1 =dataset_used1.dtypes
# temp2_1 = temp1[temp1=='object'].index
# temp3_1 = dataset_used1[temp2_1]==-1'
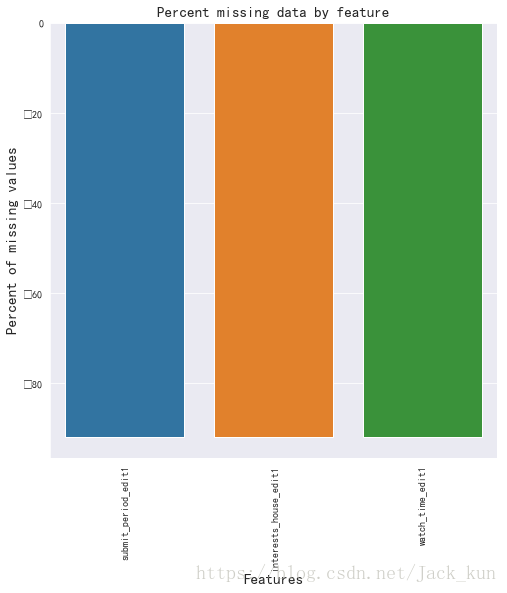
all_data_na3 = (dataset_used1[dataset_used1==-1].sum() / len(dataset_used1)) * 100
all_data_na3 = all_data_na3.drop(all_data_na3[all_data_na3 == 0].index).sort_values(ascending=False)[:30]
missing_data3 = pd.DataFrame({'Missing Ratio' :all_data_na3})
f, ax = plt.subplots(figsize=(8, 8))
plt.xticks(rotation='90')
sns.barplot(x=all_data_na3.index, y=all_data_na3)
plt.xlabel('Features', fontsize=15)
plt.ylabel('Percent of missing values', fontsize=15)
plt.title('Percent missing data by feature', fontsize=15)
Text(0.5,1,'Percent missing data by feature')
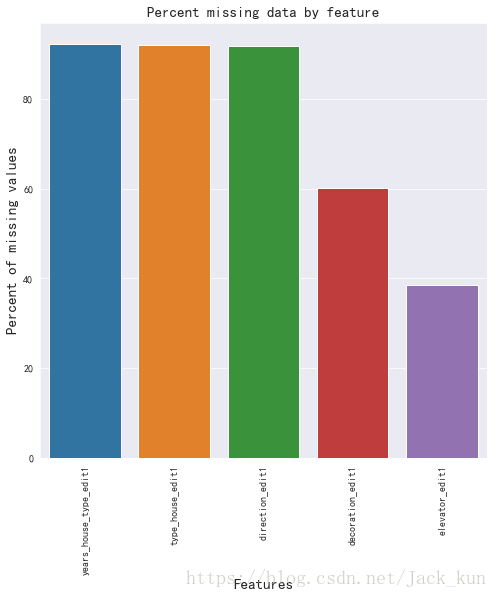
temp1 =dataset_used1.dtypes
temp2 = temp1[temp1=='object'].index
temp3 = dataset_used1[temp2]=='nodata'

all_data_na2 = (temp3.sum() / len(dataset_used1[temp2])) * 100
all_data_na2 = all_data_na2.drop(all_data_na2[all_data_na2 == 0].index).sort_values(ascending=False)[:30]
missing_data2 = pd.DataFrame({'Missing Ratio' :all_data_na2})
f, ax = plt.subplots(figsize=(8, 8))
plt.xticks(rotation='90')
sns.barplot(x=all_data_na2.index, y=all_data_na2)
plt.xlabel('Features', fontsize=15)
plt.ylabel('Percent of missing values', fontsize=15)
plt.title('Percent missing data by feature', fontsize=15)
Text(0.5,1,'Percent missing data by feature')
all_data_na = (dataset_used1.isnull().sum() / len(dataset_used1)) * 100
all_data_na = all_data_na.drop(all_data_na[all_data_na == 0].index).sort_values(ascending=False)[:30]
missing_data = pd.DataFrame({'Missing Ratio' :all_data_na})
f, ax = plt.subplots(figsize=(8, 8))
plt.xticks(rotation='90')
sns.barplot(x=all_data_na.index, y=all_data_na)
plt.xlabel('Features', fontsize=15)
plt.ylabel('Percent of missing values', fontsize=15)
plt.title('Percent missing data by feature', fontsize=15)
Text(0.5,1,'Percent missing data by feature')
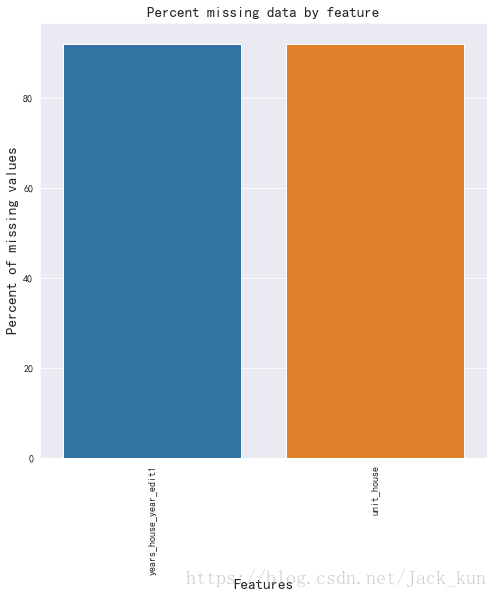
由上面可知道,主要包含有nodata的数据的变量如下,
unit_house
years_house_year_edit1,num
years_house_type_edit1
type_house_edit1
direction_edit1
decoration_edit1
elevator_edit1
watch_time_edit1,num
submit_period_edit1,num
interests_house_edit1,num
dataset_used1['unit_house'] = dataset_used1['unit_house'].fillna('nodata')
dataset_used1['years_house_year_edit1'] = dataset_used1['years_house_year_edit1'].fillna(0)
# 关于年份的处理,将其处理成距今2018的连续型年值
dataset_used1['years_house_year_edit2'] = dataset_used1['years_house_year_edit1'].apply(lambda x: 0.0 if x==0.0 else (2018.0-x))
# dataset_used1[dataset_used1['years_house_year_edit2']==2018.0] = 0.0
数值型的缺失,比例达到60%以上,难以通过相关关系的方式来插补缺失值;类别型的数据缺失比列也很大,达到40%以上,先不考虑做处理,而是先将缺失归为一类。
因此,之前在函数当中所做的处理,已经达到了缺失值的处理方式。另外,仅需将数值型的缺失值之前是记录为-1,看后续需要是否调整成0或者其它数值。
dataset_used1.info()
<class 'pandas.core.frame.DataFrame'>
Int64Index: 474294 entries, 0 to 474300
Data columns (total 22 columns):
community_house                  474294 non-null object
unit_house                       474294 non-null object
size_house_edit1                 474294 non-null float64
size_house_edit1_addcata         474294 non-null object
watch_time_edit1                 474294 non-null int64
watch_time_edit1_addcata         474294 non-null object
interests_house_edit1            474294 non-null int64
interests_house_edit1_addcata    474294 non-null object
submit_period_edit1              474294 non-null int64
submit_period_edit1_addcata      474294 non-null object
years_period_edit1               474294 non-null object
tax_free_edit1                   474294 non-null object
total_price                      474294 non-null float64
smeter_price_edit1               474294 non-null float64
direction_edit1                  474294 non-null object
decoration_edit1                 474294 non-null object
elevator_edit1                   474294 non-null object
type_house_edit1                 474294 non-null object
years_house_type_edit1           474294 non-null object
years_house_year_edit1           474294 non-null float64
region                           474294 non-null object
years_house_year_edit2           474294 non-null float64
dtypes: float64(5), int64(3), object(14)
memory usage: 83.2+ MB
dataset_used1['years_house_year_edit2'].unique()
array([ 0.,  8.,  6.,  7.,  3.,  9., 12.,  2., 14.,  1.,  4., 20.,  5.,
       13., 10., 17., 39., 26., 33., 21., 16., 22., 15., 32., 23., 37.,
       25., 29., 11., 19., 18., 31., 48., 28., 38., 36., 24., 35., 27.,
       30., 60., 43., 34., 52., 41., 42., 40., 58., 56., 54., 45., 44.,
       68., 55., 62., 64., 61., 63., 50., 59., 53., 51., 57., 46., 47.,
       66., 65., 49.])
dataset_used1.head(5)
| community_house | unit_house | size_house_edit1 | size_house_edit1_addcata | watch_time_edit1 | watch_time_edit1_addcata | interests_house_edit1 | interests_house_edit1_addcata | submit_period_edit1 | submit_period_edit1_addcata | years_period_edit1 | tax_free_edit1 | total_price | smeter_price_edit1 | direction_edit1 | decoration_edit1 | elevator_edit1 | type_house_edit1 | years_house_type_edit1 | years_house_year_edit1 | region | years_house_year_edit2 | |
|---|---|---|---|---|---|---|---|---|---|---|---|---|---|---|---|---|---|---|---|---|---|---|
| 0 | 麓山国际帕萨迪纳3组 | nodata | 98.070 | 0 | -1 | 1 | -1 | 1 | -1 | 2 | 0 | 0 | 250.000 | 10.146 | nodata | nodata | 有电梯 | nodata | nodata | 0.000 | cd | 0.000 |
| 1 | 麓山国际塞尔维蒙 | nodata | 206.000 | 0 | -1 | 1 | -1 | 1 | -1 | 2 | 0 | 0 | 420.000 | 9.923 | nodata | nodata | 无电梯 | nodata | nodata | 0.000 | cd | 0.000 |
| 2 | 麓山国际半月湾 | nodata | 112.190 | 0 | -1 | 1 | -1 | 1 | -1 | 2 | 0 | 0 | 275.000 | 10.107 | nodata | 其他 | nodata | nodata | nodata | 0.000 | cd | 0.000 |
| 3 | 心怡中丝园 | nodata | 87.560 | 0 | -1 | 1 | -1 | 1 | -1 | 2 | 0 | 0 | 193.000 | 10.001 | nodata | nodata | 有电梯 | nodata | nodata | 0.000 | cd | 0.000 |
| 4 | 麓山国际茵特拉肯A | nodata | 128.740 | 0 | -1 | 1 | -1 | 1 | -1 | 2 | 0 | 0 | 300.000 | 10.056 | nodata | 其他 | nodata | nodata | nodata | 0.000 | cd | 0.000 |
其它特征工程
1、有许多特征实际上是类别型的特征,但给出来的是数字,所以需要将其转换成类别型。
# 年份
dataset_used1['years_house_year_edit1'] = dataset_used1['years_house_year_edit1'].astype(int).apply(str)
dataset_used1['region'].unique()
array(['cd', 'xm', 'sh', 'sz', 'zz', 'qd', 'su', 'cq', 'dl', 'hf', 'sjz',
       'cs', 'wh', 'nj', 'hz', 'tj', 'gz', 'bj', 'lf', 'jn', 'fs', 'zh',
       'zs'], dtype=object)
2、接下来 LabelEncoder,对部分类别的特征进行编号。
temp_ds = dataset_used1
from sklearn.preprocessing import LabelEncoder
temp2
Index(['community_house', 'unit_house', 'size_house_edit1_addcata',
       'watch_time_edit1_addcata', 'interests_house_edit1_addcata',
       'submit_period_edit1_addcata', 'years_period_edit1', 'tax_free_edit1',
       'direction_edit1', 'decoration_edit1', 'elevator_edit1',
       'type_house_edit1', 'years_house_type_edit1', 'region'],
      dtype='object')
temp1 =dataset_used1.dtypes
temp2 = temp1[temp1=='object'].index
# 使用LabelEncoder做变换
for c in temp2:
    lbl = LabelEncoder()
    lbl.fit(list(temp_ds[c].unique()))
    temp_ds[c] = lbl.transform(list(temp_ds[c].values))
list(temp_ds[c].unique())
[1,
 19,
 13,
 16,
 22,
 12,
 15,
 2,
 4,
 7,
 14,
 3,
 18,
 11,
 8,
 17,
 6,
 0,
 10,
 9,
 5,
 20,
 21]
# 查看维度
print('temp_ds的数据维度: {}'.format(temp_ds.shape))
temp_ds.tail()
temp_ds的数据维度: (474294, 22)
| community_house | unit_house | size_house_edit1 | size_house_edit1_addcata | watch_time_edit1 | watch_time_edit1_addcata | interests_house_edit1 | interests_house_edit1_addcata | submit_period_edit1 | submit_period_edit1_addcata | years_period_edit1 | tax_free_edit1 | total_price | smeter_price_edit1 | direction_edit1 | decoration_edit1 | elevator_edit1 | type_house_edit1 | years_house_type_edit1 | years_house_year_edit1 | region | years_house_year_edit2 | |
|---|---|---|---|---|---|---|---|---|---|---|---|---|---|---|---|---|---|---|---|---|---|---|
| 474296 | 29485 | 71 | 0.000 | 1 | -1 | 1 | -1 | 1 | -1 | 1 | 0 | 0 | 106.000 | 8.893 | 15 | 0 | 0 | 0 | 0 | 0 | 21 | 0.000 |
| 474297 | 29485 | 71 | 0.000 | 1 | -1 | 1 | -1 | 1 | -1 | 1 | 0 | 0 | 100.000 | 8.805 | 15 | 0 | 0 | 0 | 0 | 0 | 21 | 0.000 |
| 474298 | 19899 | 71 | 0.000 | 1 | -1 | 1 | -1 | 1 | -1 | 1 | 0 | 0 | 18.000 | 8.923 | 15 | 0 | 0 | 0 | 0 | 0 | 21 | 0.000 |
| 474299 | 19899 | 71 | 0.000 | 1 | -1 | 1 | -1 | 1 | -1 | 1 | 0 | 0 | 15.000 | 8.661 | 15 | 0 | 0 | 0 | 0 | 0 | 21 | 0.000 |
| 474300 | 19899 | 71 | 0.000 | 1 | -1 | 1 | -1 | 1 | -1 | 1 | 0 | 0 | 19.000 | 8.977 | 15 | 0 | 0 | 0 | 0 | 0 | 21 | 0.000 |
temp_ds.describe()
| community_house | unit_house | size_house_edit1 | size_house_edit1_addcata | watch_time_edit1 | watch_time_edit1_addcata | interests_house_edit1 | interests_house_edit1_addcata | submit_period_edit1 | submit_period_edit1_addcata | years_period_edit1 | tax_free_edit1 | total_price | smeter_price_edit1 | direction_edit1 | decoration_edit1 | elevator_edit1 | type_house_edit1 | years_house_type_edit1 | years_house_year_edit1 | region | years_house_year_edit2 | |
|---|---|---|---|---|---|---|---|---|---|---|---|---|---|---|---|---|---|---|---|---|---|---|
| count | 474294.000 | 474294.000 | 474294.000 | 474294.000 | 474294.000 | 474294.000 | 474294.000 | 474294.000 | 474294.000 | 474294.000 | 474294.000 | 474294.000 | 474294.000 | 474294.000 | 474294.000 | 474294.000 | 474294.000 | 474294.000 | 474294.000 | 474294.000 | 474294.000 | 474294.000 |
| mean | 27267.773 | 66.229 | 82.180 | 0.142 | 0.453 | 0.920 | 3.421 | 0.920 | 7.452 | 0.920 | 0.064 | 0.074 | 329.748 | -inf | 18.814 | 0.906 | 0.969 | 0.410 | 0.282 | 4.111 | 10.437 | 1.316 |
| std | 16331.565 | 16.362 | 59.727 | 0.349 | 9.743 | 0.272 | 25.412 | 0.272 | 40.624 | 0.272 | 0.245 | 0.262 | 360.473 | nan | 14.090 | 1.385 | 0.858 | 1.502 | 1.022 | 14.184 | 6.538 | 5.132 |
| min | 0.000 | 0.000 | 0.000 | 0.000 | -1.000 | 0.000 | -1.000 | 0.000 | -1.000 | 0.000 | 0.000 | 0.000 | 4.000 | -inf | 0.000 | 0.000 | 0.000 | 0.000 | 0.000 | 0.000 | 0.000 | 0.000 |
| 25% | 12779.000 | 71.000 | 50.080 | 0.000 | -1.000 | 1.000 | -1.000 | 1.000 | -1.000 | 1.000 | 0.000 | 0.000 | 143.000 | 9.755 | 15.000 | 0.000 | 0.000 | 0.000 | 0.000 | 0.000 | 4.000 | 0.000 |
| 50% | 27253.000 | 71.000 | 80.170 | 0.000 | -1.000 | 1.000 | -1.000 | 1.000 | -1.000 | 1.000 | 0.000 | 0.000 | 235.000 | 10.153 | 15.000 | 0.000 | 1.000 | 0.000 | 0.000 | 0.000 | 12.000 | 0.000 |
| 75% | 41835.000 | 71.000 | 106.100 | 0.000 | -1.000 | 1.000 | -1.000 | 1.000 | -1.000 | 1.000 | 0.000 | 0.000 | 390.000 | 10.713 | 15.000 | 1.000 | 2.000 | 0.000 | 0.000 | 0.000 | 16.000 | 0.000 |
| max | 55144.000 | 76.000 | 1823.970 | 1.000 | 851.000 | 1.000 | 2701.000 | 1.000 | 365.000 | 1.000 | 1.000 | 1.000 | 35000.000 | 12.206 | 101.000 | 4.000 | 2.000 | 8.000 | 5.000 | 67.000 | 22.000 | 68.000 |
temp_ds['smeter_price_edit1'].unique()
array([10.14615918,  9.92279986, 10.10695887, ..., 11.19759809,
       11.28816811, 11.33664164])
3、检查变量的正态分布情况
对房价进行分析,不符合正态分布的将其log转换,使其符合正态分布;那么偏离正态分布太多的特征我们也对它进行转化:
检查
total_price = temp_ds['total_price']
temp_ds.drop('total_price', axis=1, inplace=True)
# numeric_feats = dataset_used1.dtypes[dataset_used1.dtypes != "object"].index
numeric_feats = ['size_house_edit1', 'watch_time_edit1', 'interests_house_edit1', 'submit_period_edit1']
# 对所有数值型的特征都计算skew,即计算一下偏度

skewed_feats = temp_ds[numeric_feats].apply(lambda x: skew(x.dropna())).sort_values(ascending=False)
print("\nSkew in numerical features: \n")
skewness = pd.DataFrame({'Skew' :skewed_feats})
skewness.head()
Skew in numerical features:
| Skew | |
|---|---|
| watch_time_edit1 | 16.240 |
| interests_house_edit1 | 15.395 |
| submit_period_edit1 | 6.197 |
| size_house_edit1 | 2.478 |
变换处理
skewness = skewness[abs(skewness) > 0.75]  # 关于临界值,如何定,不知??
print("总共有 {} 数值型的特征做变换".format(skewness.shape[0]))

from scipy.special import boxcox1p
skewed_features = skewness.index
lam = 0.15
for feat in skewed_features:
    #all_data[feat] += 1
    temp_ds[feat] = boxcox1p(temp_ds[feat], lam)
总共有 4 数值型的特征做变换
temp_ds.info()
<class 'pandas.core.frame.DataFrame'>
Int64Index: 474294 entries, 0 to 474300
Data columns (total 21 columns):
community_house                  474294 non-null int64
unit_house                       474294 non-null int64
size_house_edit1                 474294 non-null float64
size_house_edit1_addcata         474294 non-null int64
watch_time_edit1                 474294 non-null float64
watch_time_edit1_addcata         474294 non-null int64
interests_house_edit1            474294 non-null float64
interests_house_edit1_addcata    474294 non-null int64
submit_period_edit1              474294 non-null float64
submit_period_edit1_addcata      474294 non-null int64
years_period_edit1               474294 non-null int64
tax_free_edit1                   474294 non-null int64
smeter_price_edit1               474294 non-null float64
direction_edit1                  474294 non-null int64
decoration_edit1                 474294 non-null int64
elevator_edit1                   474294 non-null int64
type_house_edit1                 474294 non-null int64
years_house_type_edit1           474294 non-null int64
years_house_year_edit1           474294 non-null int64
region                           474294 non-null int64
years_house_year_edit2           474294 non-null float64
dtypes: float64(6), int64(15)
memory usage: 79.6 MB
这里偏差修正的问题,如果先进行labelcoding,那么如何保证label之后的结果是string?还是说提取单独的数值型列?
最后,我决定单独取出
temp_ds.head()
| community_house | unit_house | size_house_edit1 | size_house_edit1_addcata | watch_time_edit1 | watch_time_edit1_addcata | interests_house_edit1 | interests_house_edit1_addcata | submit_period_edit1 | submit_period_edit1_addcata | years_period_edit1 | tax_free_edit1 | smeter_price_edit1 | direction_edit1 | decoration_edit1 | elevator_edit1 | type_house_edit1 | years_house_type_edit1 | years_house_year_edit1 | region | years_house_year_edit2 | |
|---|---|---|---|---|---|---|---|---|---|---|---|---|---|---|---|---|---|---|---|---|---|
| 0 | 54124 | 71 | 6.616 | 0 | -6.667 | 1 | -6.667 | 1 | -6.667 | 1 | 0 | 0 | 10.146 | 15 | 0 | 2 | 0 | 0 | 0 | 1 | 0.000 |
| 1 | 54121 | 71 | 8.169 | 0 | -6.667 | 1 | -6.667 | 1 | -6.667 | 1 | 0 | 0 | 9.923 | 15 | 0 | 1 | 0 | 0 | 0 | 1 | 0.000 |
| 2 | 54117 | 71 | 6.885 | 0 | -6.667 | 1 | -6.667 | 1 | -6.667 | 1 | 0 | 0 | 10.107 | 15 | 1 | 0 | 0 | 0 | 0 | 1 | 0.000 |
| 3 | 23640 | 71 | 6.395 | 0 | -6.667 | 1 | -6.667 | 1 | -6.667 | 1 | 0 | 0 | 10.001 | 15 | 0 | 2 | 0 | 0 | 0 | 1 | 0.000 |
| 4 | 54131 | 71 | 7.165 | 0 | -6.667 | 1 | -6.667 | 1 | -6.667 | 1 | 0 | 0 | 10.056 | 15 | 1 | 0 | 0 | 0 | 0 | 1 | 0.000 |
temp_ds.info()
<class 'pandas.core.frame.DataFrame'>
Int64Index: 474294 entries, 0 to 474300
Data columns (total 21 columns):
community_house                  474294 non-null int64
unit_house                       474294 non-null int64
size_house_edit1                 474294 non-null float64
size_house_edit1_addcata         474294 non-null int64
watch_time_edit1                 474294 non-null float64
watch_time_edit1_addcata         474294 non-null int64
interests_house_edit1            474294 non-null float64
interests_house_edit1_addcata    474294 non-null int64
submit_period_edit1              474294 non-null float64
submit_period_edit1_addcata      474294 non-null int64
years_period_edit1               474294 non-null int64
tax_free_edit1                   474294 non-null int64
smeter_price_edit1               474294 non-null float64
direction_edit1                  474294 non-null int64
decoration_edit1                 474294 non-null int64
elevator_edit1                   474294 non-null int64
type_house_edit1                 474294 non-null int64
years_house_type_edit1           474294 non-null int64
years_house_year_edit1           474294 non-null int64
region                           474294 non-null int64
years_house_year_edit2           474294 non-null float64
dtypes: float64(6), int64(15)
memory usage: 79.6 MB
哑变量处理
temp1 =dataset_used1.dtypes
temp2 = temp1[temp1=='int64'].index
for name in temp2:
    temp_ds[name] = temp_ds[name].astype(str)

temp2_2 = temp1[temp1=='float64'].index
for name in temp2_2:
    temp_ds[name] = temp_ds[name].astype(float)
temp_ds_use1 = temp_ds.drop(['community_house','years_house_year_edit1'], axis=1)
all_usedata = pd.get_dummies(temp_ds_use1)
all_usedata.shape
(474294, 243)
useful_dataset = all_usedata.sample(frac=0.1, random_state=123)
all_usedata = None
del all_usedata,temp_ds,temp_ds_use1,dataset_used1,dataset
建立模型
from sklearn.linear_model import ElasticNet, Lasso,  BayesianRidge, LassoLarsIC
from sklearn.ensemble import RandomForestRegressor,  GradientBoostingRegressor
from sklearn.kernel_ridge import KernelRidge
from sklearn.pipeline import make_pipeline
from sklearn.preprocessing import RobustScaler
from sklearn.base import BaseEstimator, TransformerMixin, RegressorMixin, clone
from sklearn.model_selection import KFold, cross_val_score, train_test_split
from sklearn.metrics import mean_squared_error
import xgboost as xgb
import lightgbm as lgb
数据准备
X = useful_dataset.drop('smeter_price_edit1', axis=1)
y = useful_dataset['smeter_price_edit1']
# 注意这一步!!数据结果与类型转换
X = X.as_matrix().astype(np.float)
y = y.as_matrix().astype(np.float)
# all_data_na = (Train.isnull().sum() / len(Train)) * 100
# all_data_na = all_data_na.drop(all_data_na[all_data_na == 0].index).sort_values(ascending=False)[:30]
# missing_data = pd.DataFrame({'Missing Ratio' :all_data_na})

# f, ax = plt.subplots(figsize=(8, 8))
# plt.xticks(rotation='90')
# sns.barplot(x=missing_data.index, y=all_data_na)
# plt.xlabel('Features', fontsize=15)
# plt.ylabel('Percent of missing values', fontsize=15)
# plt.title('Percent missing data by feature', fontsize=15)
# 训练集与测试集划分
train_x, test_x, train_y, test_y = train_test_split(X, y, test_size=0.2)
# 交叉验证函数
n_folds = 5
def rmsle_cv(model):
    kf = KFold(n_folds, shuffle=True, random_state=42).get_n_splits(train_x)
    rmse= np.sqrt(-cross_val_score(model, train_x, train_y, scoring="neg_mean_squared_error", cv = kf))
    return(rmse)
模型函数
模型函数设定
lasso模型
lasso = make_pipeline(RobustScaler(), Lasso(alpha =0.5, random_state=1))
ENet模型
ENet = make_pipeline(RobustScaler(), ElasticNet(alpha=0.5, l1_ratio=.9, random_state=3))
KRR模型
KRR = KernelRidge(alpha=0.6, kernel='polynomial', degree=2, coef0=2.5)
GBoost模型
GBoost = GradientBoostingRegressor(n_estimators=1000, learning_rate=0.1,
                                   max_depth=6, max_features='sqrt',
                                   min_samples_leaf=15, min_samples_split=10,
                                   loss='huber', random_state =5)
xgboost模型
model_xgb = xgb.XGBRegressor(colsample_bytree=0.4603, gamma=0.0468,
                             learning_rate=0.1, max_depth=6,
                             min_child_weight=1.7817, n_estimators=1000,
                             reg_alpha=0.4640, reg_lambda=0.8571,
                             subsample=0.5213, silent=1,
                             seed =7, nthread = -1)
LightGBM模型
model_lgb = lgb.LGBMRegressor(objective='regression',num_leaves=5,
                              learning_rate=0.05, n_estimators=720,
                              max_bin = 55, bagging_fraction = 0.8,
                              bagging_freq = 5, feature_fraction = 0.2319,
                              feature_fraction_seed=9, bagging_seed=9,
                              min_data_in_leaf =6, min_sum_hessian_in_leaf = 11)
模型得分
score = rmsle_cv(lasso)
print("\nLasso 得分: {:.4f} ({:.4f})\n".format(score.mean(), score.std()))
Lasso 得分: 0.6099 (0.0034)
score = rmsle_cv(ENet)
print("\ENet 得分: {:.4f} ({:.4f})\n".format(score.mean(), score.std()))
\ENet 得分: 0.6085 (0.0034)
lasso = make_pipeline(RobustScaler(), Lasso(alpha =0.001, random_state=1))

score = rmsle_cv(lasso)
print("\nLasso 得分: {:.4f} ({:.4f})\n".format(score.mean(), score.std()))
Lasso 得分: 0.3598 (0.0028)
ENet = make_pipeline(RobustScaler(), ElasticNet(alpha=0.001, l1_ratio=.9, random_state=3))
score = rmsle_cv(ENet)
print("\ENet 得分: {:.4f} ({:.4f})\n".format(score.mean(), score.std()))
\ENet 得分: 0.3593 (0.0029)
score = rmsle_cv(KRR)
print("Kernel Ridge 得分: {:.4f} ({:.4f})\n".format(score.mean(), score.std()))
krr运行时间太长,没有执行和给出结果
score = rmsle_cv(GBoost)
print("Gradient Boosting 得分: {:.4f} ({:.4f})\n".format(score.mean(), score.std()))
Gradient Boosting 得分: 0.3328 (0.0041)
score = rmsle_cv(GBoost)
print("Gradient Boosting 得分: {:.4f} ({:.4f})\n".format(score.mean(), score.std()))
Gradient Boosting 得分: 0.3271 (0.0023)
score = rmsle_cv(model_xgb)
print("Xgboost 得分: {:.4f} ({:.4f})\n".format(score.mean(), score.std()))
Xgboost 得分: 0.3362 (0.0018)
score = rmsle_cv(model_xgb)
print("Xgboost 得分: {:.4f} ({:.4f})\n".format(score.mean(), score.std()))
Xgboost 得分: 0.3294 (0.0014)
score = rmsle_cv(model_lgb)
print("Xgboost 得分: {:.4f} ({:.4f})\n".format(score.mean(), score.std()))
Xgboost 得分: 0.3400 (0.0034)
模型融合
从简单的基本模型方法开始,考虑通过多模型融合的方式,尝试提高整体得分。首先构建简单类,扩充sklearn模型,然后根据初步融合结果进一步优化基模型参数,最后有所应用。
from sklearn.base import BaseEstimator, TransformerMixin, RegressorMixin, clone
基模型融合
class AverageModels(BaseEstimator, RegressorMixin, TransformerMixin):
    def __init__(self, models):
        self.models = models

    # 遍历所有模型
    def fit(self, X, y):
        self.models_ = [clone(x) for x in self.models]
        for model in self.models_:
            model.fit(X, y)
        return self

    # 预估,并对预估结果做average
    def predict(self, X):
        predictions = np.column_stack([model.predict(X) for model in self.models_])
        return np.mean(predictions, axis=1)
average_models = AverageModels(models=(lasso,ENet,GBoost))
score = rmsle_cv(average_models)
print('对基模型进行集成之后的得分:{:.4f} ({:.4f})\n'.format(score.mean(), score.std()))
对基模型进行集成之后的得分:0.3403 (0.0029)
对上面的结果对比,发现方差相比较单独模型有所降低,均值很低。故认为模型的融合起到改善预测结果的效果,所以考虑对单独模型构建更深层的模型融合。
import numpy as np
# np.array((1,2,3),(11,22,33))
a=[1,2,3];b=[11,22,33];np.column_stack((a,b))
a=[[1,2,3],[10,20,30]];b=[[11,22,33],[110,220,330]];np.column_stack((a,b))
array([[  1,   2,   3,  11,  22,  33],
       [ 10,  20,  30, 110, 220, 330]])
ab = np.column_stack([np.array(a),np.array(b)])
print(ab,ab.shape)
ab.mean(axis=1)
[[ 1 11]
 [ 2 22]
 [ 3 33]] (3, 2)


array([  6.,  12.,  18.])
ab = np.column_stack([np.array(a)])
print(ab,ab.shape)
ab.mean(axis=1)
[[1]
 [2]
 [3]] (3, 1)


array([ 1.,  2.,  3.])
a=[1,2,3];b=[11,22,33];
np.column_stack((a,b)).mean(axis=1)
array([ 6., 12., 18.])
[np.column_stack([i]*4) for i in list(range(1,4))]
[array([[1, 1, 1, 1]]), array([[2, 2, 2, 2]]), array([[3, 3, 3, 3]])]
[np.column_stack([i]*4).mean(axis=1) for i in list(range(1,4))]
[array([ 1.]), array([ 2.]), array([ 3.])]
构建stacking averagd models的类
通过stacking的方式进行模型融合
class StackingAverageModels(BaseEstimator, RegressorMixin, TransformerMixin):
    def __init__(self, base_models, meta_model, n_folds):
        self.base_models = base_models
        self.meta_model = meta_model
        self.n_folds = n_folds

    # 遍历拟合原始模型
    def fit(self, X, y):
        self.base_models_ = [list() for x in self.base_models]
        self.meta_model_ = clone(self.meta_model)
        kfold = KFold(n_splits=self.n_folds, shuffle=True, random_state=123)

        # 得到基模型之后,对out_of_fold的数据做预估,并为学习stacking的第二层做数据准备
        out_of_fold_predictions = np.zeros((X.shape[0], len(self.base_models)), dtype=np.float64)

        for i, model in enumerate(self.base_models):
            for train_index, holdout_index in kfold.split(X, y):
                instance = clone(model)
                self.base_models_[i].append(instance)
                instance.fit(X[train_index], y[train_index])
                y_pred = instance.predict(X[holdout_index])
                out_of_fold_predictions[holdout_index, i] = y_pred

        # 学习stacking模型
        self.meta_model_.fit(out_of_fold_predictions, y)
        return self

    # 做stacking预估
    def predict(self, X):
        meta_features = np.column_stack([
            np.column_stack([model.predict(X) for model in base_models]).mean(axis=1)
            for base_models in self.base_models_])

        return self.meta_model_.predict(meta_features)
- 测试meta-model的stacking结果
import datetime
now = datetime.datetime.now()
print(now)
2018-08-13 09:25:11.523184
stacked_averaged_model = StackingAverageModels(base_models=(ENet, GBoost), meta_model=lasso, n_folds=5)

score = rmsle_cv(stacked_averaged_model)
print('对基模型进行集成之后的得分:{:.4f} ({:.4f})\n'.format(score.mean(), score.std()))
对基模型进行集成之后的得分:0.6017 (0.0024)
测试模型融合
def rmsle(y, y_pred):
    return np.sqrt(mean_squared_error(y, y_pred))
stacking
stacked_averaged_model.fit(train_x, train_y)
stacked_train_pred = stacked_averaged_model.predict(train_x)
stacked_pred = np.expm1(stacked_averaged_model.predict(test_x))
print(rmsle(train_y, stacked_train_pred))
print(rmsle(test_y, stacked_pred))
0.6017301501182424
30684.936189730954
xgboost
model_xgb.fit(train_x, train_y)
xgb_train_pred = model_xgb.predict(train_x)
xgb_pred = np.expm1(model_xgb.predict(test_x))
print(rmsle(train_y, xgb_train_pred))
print(rmsle(test_y, xgb_pred))
0.28768534370101895
36986.13921042293
lightgbm
model_lgb.fit(train_x, train_y)
gbm_train_pred = model_lgb.predict(train_x)
gbm_pred = np.expm1(model_lgb.predict(test_x))
print(rmsle(train_y, gbm_train_pred))
print(rmsle(test_y, gbm_pred))
0.33701688354734044
36068.90124078451
now = datetime.datetime.now()
print(now)
np.expm1(0)
0.0
在测试集上面的表现很差,不理解为何差异非常大。
结果
ensemble = stacked_pred*0.4 + xgb_pred*0.3 + lgb_pred*0.3