1. 配置PHP xdebug
第一步:首先从https://xdebug.org/download.php下载相应版本(和php相对应的)的xdebug,这样就可以获取到一个dll(windows环境下)。因为我的是php-7.2.8-Win32-VC15-x64,故而下载得到是php_xdebug-2.7.0alpha1-7.2-vc15-x86_64.dll文件。将该dll文件复制到${PHP}/ext目录下。
第二步:编辑${PHP}目录下php.ini文件,在文件的末尾添加
zend_extension="D:/PHP/php-7.2.8-Win32-VC15-x64/ext/php_xdebug-2.7.0alpha1-7.2-vc15-x86_64.dll"
xdebug.profiler_enable=on
xdebug.trace_output_dir="e:/xdebug-log" ;xdebug 的数据文件目录
xdebug.profiler_output_dir="e:/xdebug-log" ;xdebug 的数据文件目录
xdebug.auto_trace = On ;开启自动跟踪
xdebug.show_exception_trace = On ;开启异常跟踪
xdebug.remote_autostart = Off ;开启远程调试自动启动
xdebug.remote_enable = On ;开启远程调试
xdebug.remote_handler=dbgp ;用于远程调试的应用层通信协议
xdebug.remote_host=127.0.0.1 ;允许连接的IP地址
xdebug.remote_port=9001 ;反向连接使用的端口
xdebug.collect_vars = On ;收集变量
xdebug.collect_return = On ;收集返回值
xdebug.collect_params = On ;收集参数
xdebugbug.max_nesting_level = 10000 ;如果设得太小,函数中有递归调用自身次数太多时会报超过最大嵌套数错
注意:其中zend_extension要根据自己的需要进行修改,xdebug.remote_port是连接端口号,设置为9001
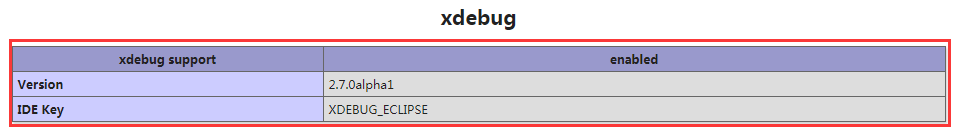
第三步:测试。启动apache服务器,在根目录下建立一个文件php.php,其内容为
<?php
 echo phpinfo();
?>
如果从浏览器访问能看到如下红框的内容,表示服务器端配置完成
2. 安装chrome插件Xdebug Helper
从google的网上应用店https://chrome.google.com/webstore/detail/xdebug-helper/eadndfjplgieldjbigjakmdgkmoaaaoc?hl=zh-CN 安装插件Xdebug Helper。安装完成以后,chrome会多出一个小虫子的图标。如下图:

3. PHPSTORM
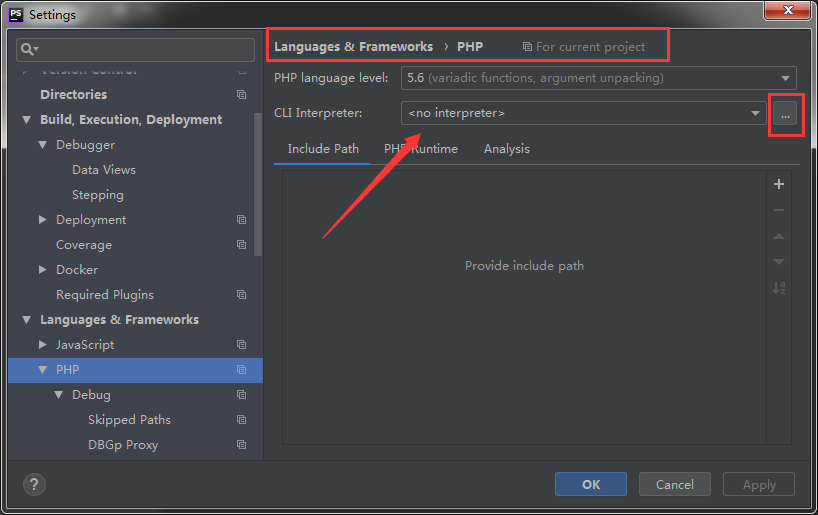
3.1. 设置PHP解释器
第一步:【File】>【Settings】>【Language & Framework】> PHP(如下图)对话框中【CLI Interpreter】,鼠标单击栏位右侧的【...】按钮,就会出现【CLI Interpreters】对话框
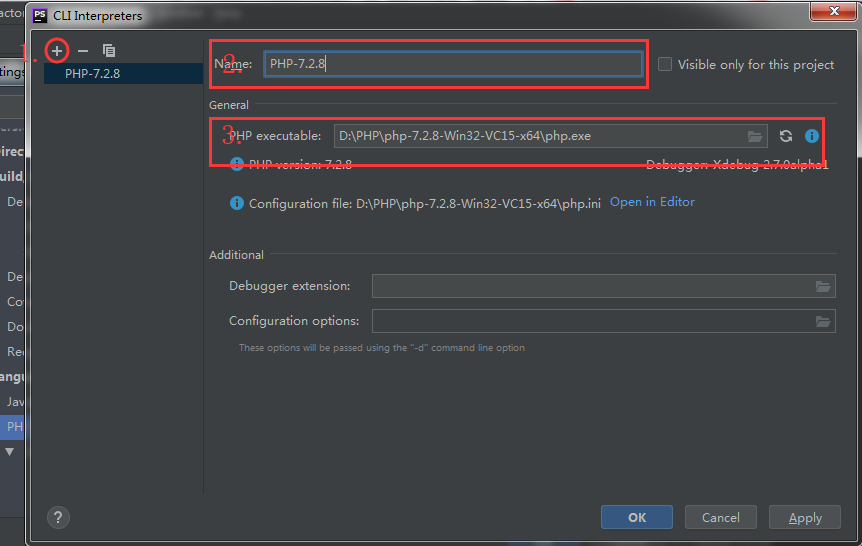
第二步:在【CLI Interpreters】对话框中,鼠标点击左侧栏上方的【+】按钮,会出现一个小的popup窗口,选择该窗口中的【Local Path to Interpreter...】的选项
在【Name】栏位输入该PHP Interpreter的名字,在【PHP execuatable】栏位输入具体的php.exe执行路径
3.2. 设置DEUBG
第一步:【File】>【Settings】>【Language & Framework】> PHP>DEBUG,将端口改成9001(和服务器设置一致)