Kibana 总结

中文网站:http://kibana.logstash.es/content/kibana/v4/setup.html
概述
Kibana 主要是查看ES状态的一个工具,因有较强的图标界面的操作受到了广大用户的喜爱。
安装Kibana
软件下载:链接:http://pan.baidu.com/s/1slrhJ8x 密码:vesj 如果无法下载请联系作者。
1-1)、安装Kibana
[root@hadoop1 local]# tar -zxvf kibana-4.5.0-linux-x64.tar.gz
[root@hadoop1 local]# mv kibana-4.5.0-linux-x64/ kibana
[root@hadoop1 local]# cd kibana
1-2)、配置Kibana
[root@hadoop1 kibana]# cd config/
[root@hadoop1 config]# vi kibana.yml
加入以下配置:
# The Elasticsearch instance to use for all your queries.
elasticsearch.url: "http://hadoop1:9200"
1-3)、设置快捷方式
[root@hadoop1 bin]# vi /etc/profile
export KIBANA_HOME=/usr/local/kibana
[root@hadoop1 bin]# source /etc/profile
启动
先要启动elasticsearch
1-1)、前台启动
[root@hadoop1 bin]# ./kibana
log [22:06:10.964] [info][status][plugin:kibana] Status changed from uninitialized to green - Ready
log [22:06:11.027] [info][status][plugin:elasticsearch] Status changed from uninitialized to yellow - Waiting for Elasticsearch
log [22:06:11.056] [info][status][plugin:kbn_vislib_vis_types] Status changed from uninitialized to green - Ready
log [22:06:11.074] [info][status][plugin:markdown_vis] Status changed from uninitialized to green - Ready
log [22:06:11.087] [info][status][plugin:metric_vis] Status changed from uninitialized to green - Ready
log [22:06:11.101] [info][status][plugin:spyModes] Status changed from uninitialized to green - Ready
log [22:06:11.180] [info][status][plugin:statusPage] Status changed from uninitialized to green - Ready
log [22:06:11.196] [info][status][plugin:table_vis] Status changed from uninitialized to green - Ready
log [22:06:11.213] [info][status][plugin:elasticsearch] Status changed from yellow to green - Kibana index ready
log [22:06:11.233] [info][listening] Server running at http://0.0.0.0:5601
1-2)、后台启动
[root@hadoop1 bin]# ./kibana 2>/dev/null &
查看界面
端口是:5601
1-1)、kibana 的界面
http://hadoop1:5601/status

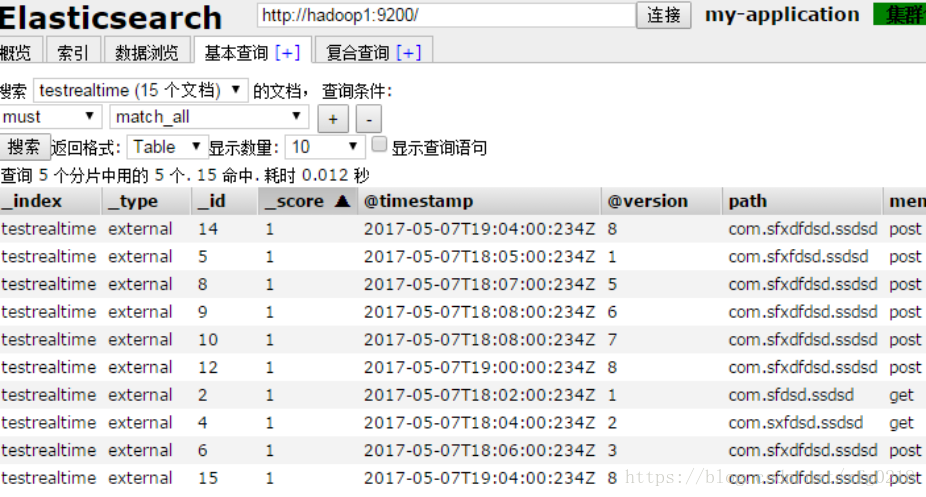
1-2)、Elasticsearch 的数据库的信息

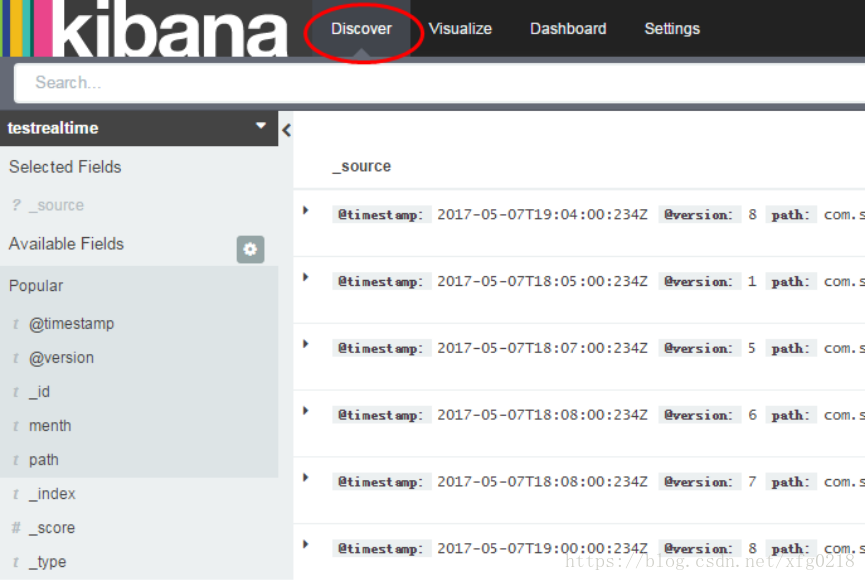
1-3)、数据查看

查询数据
1-1)、查看数据
1-2)、增加索引

1-3)、出现了如图所示

1-4)、查看字段的属性信息

1-5)、查看字段的属性信息
1-6)、选择图标进行展示

1-7)、选择字段进行展示

1-8)、选择不同的图标进行展示
