版权声明:(谢厂节的博客)博主文章绝大部分非原创,转载望留链接。 https://blog.csdn.net/xundh/article/details/82454442
说明
Spring Boot提供了spring-boot-starter-actuator模块,用于管理和监控应用。
使用方式
在pom.xml加入依赖项:
        <dependency>
            <groupId>org.springframework.boot</groupId>
            <artifactId>spring-boot-starter-actuator</artifactId>
        </dependency>
程序启动时可以看到:
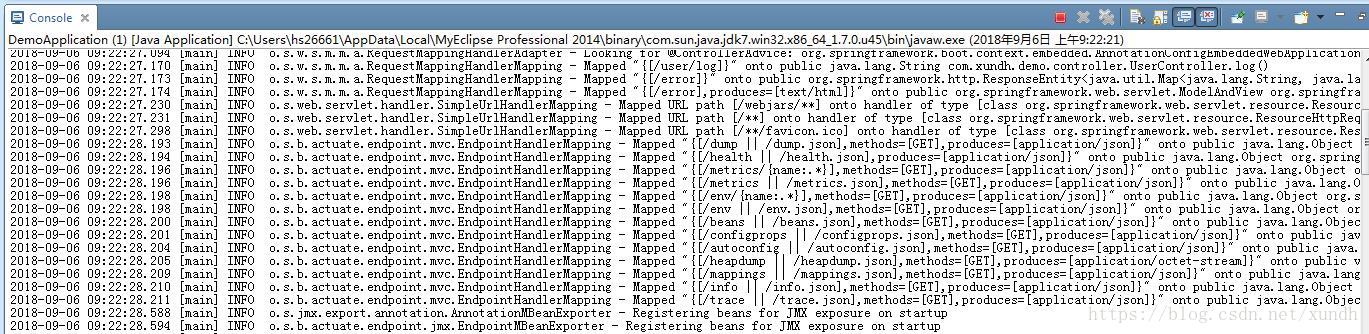
这样模块已经加载进来,通过这些节点,可以实时获取应用的各项监控指标,如:
访问: http://localhost:8080/health
可以看到:
{"status":"UP","diskSpace":{"status":"UP","total":195035131904,"free":19142193152,"threshold":10485760},"db":{"status":"UP","database":"MySQL","hello":1}}配置文件设置
application.properties
### 应用监控配置
# 指定访问这些监控方法的端口
# management.port
# 指定地址,如只能通过本机监控,可以设置:
# management.address=127.0.0.1
# 敏感信息访问限制
# endpoints.bean.sensitive=false
# 设置关闭安全限制
management.security.enabled=false
监控项
| HTTP方法 | 路径 | 描述 | 鉴权 |
|---|---|---|---|
| GET | /autoconfig | 查看自动配置的使用情况 | true |
| GET | /configprops | 查看配置属性,包括默认配置 | true |
| GET | /beans | 查看bean及其关系列表 | true |
| GET | /dump | 打印线程栈 | true |
| GET | /env | 查看所有环境变量 | true |
| GET | /env/{name} | 查看具体变量值 | true |
| GET | /health | 查看应用健康指标 | false |
| GET | /info | 查看应用信息(需要自己在application.properties里头添加信息,比如[email protected]) | false |
| GET | /mappings | 查看所有url映射 | true |
| GET | /metrics | 查看应用基本指标 | true |
| GET | /metrics/{name} | 查看具体指标 | true |
| POST | /shutdown | 关闭应用(要真正生效,得配置文件开启endpoints.shutdown.enabled: true) | true |
| GET | /trace | 查看基本追踪信息 | true |
为了在Chrome中便于查看,可以安装JsonView插件。
自定义端点
自定义端点只需要继承抽象类 AbstractEndpoint即可。