Spring Boot——监控管理
一、监控管理
通过引入spring-boot-starter-actuator,可以使用Spring Boot为我们提供的准生产环境下的应用监控和管理功能。我们可以通过HTTP,JMX,SSH协议来进行操作,自动得到审计、健康及指标信息等
1、引入依赖
<dependency>
    <groupId>org.springframework.boot</groupId>
    <artifactId>spring-boot-starter-actuator</artifactId>
</dependency>
2、配置
server:
  port: 8015
spring:
  application:
    name: springboot-actuator
management:
  endpoints:
    web:
      exposure:
        include: "*" #打开所有的监控点
      base-path: /monitor #自定义监控路径默认为http://localhost:8015/actuator
  endpoint:
    health:
      show-details:  always
    shutdown:
      enabled: true #通过指定接口关闭springboot
# 描述项目基础信息
info:
  app:
    name: boot-actuator
    port: 8015
    version: 1.0.0
    author: glp
也可以单独配置单个权限:
# 开启beans 、 mappings 访问
management.endpoints.web.exposure.include=beans,mappings
3、通过http方式访问监控端点
具体内容如下:
/auditevents:显示应⽤暴露的审计事件(⽐如认证进⼊)/beans:显示应⽤程序中所有 Spring Bean 的完整列表/caches:公开可⽤的缓存 /conditions:显示在配置和⾃动配置类上评估的条件以及它们匹配或不匹配的原因/configprops:显示所有 @ConfigurationPropertie 的整理列表/env:获取全部环境属性/flyway:提供⼀份 Flyway 数据库迁移信息/health:显示应⽤程序运⾏状况信息/httptrace:显示 HTTP 跟踪信息(默认情况下,最近 100 个 HTTP 请求-响 应交换)/info:获取应⽤程序的定制信息,这些信息由 info 开头的属性提供/integrationgraph:显示 Spring Integration 图,需要依赖于 spring-integration-
core/loggers:显示和修改应⽤程序的配置/liquibase:显示已应⽤的所有 Liquibase 数据库迁移/metrics/{name}:报告指定名称的应⽤程序度量值/mappings:显示所有 @RequestMapping 路径的列表/scheduledtasks:显示应⽤程序中的计划任务/sessions:允许从 Spring Session ⽀持的会话存储中检索和删除⽤户会话,需要使⽤ Spring Session 基于Servlet 的 Web 应⽤程序/shutdown:使应⽤程序正常关闭,默认禁⽤/threaddump:获取线程活动的快照
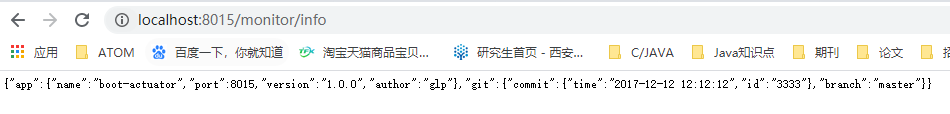
(1)访问项目描述信息
http://localhost:8015/monitor/info
可以编写一个git.properties用来描述git的相关信息
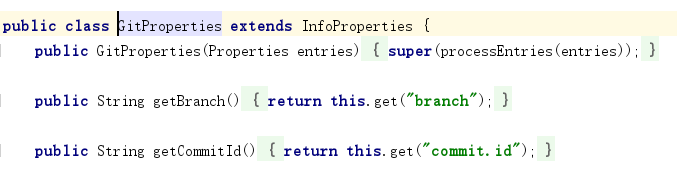
git.branch =master
git.commit.id = 3333
git.commit.time = 2017-12-12 12:12:12
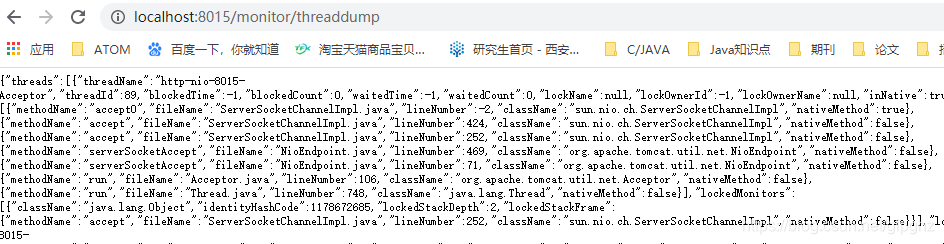
(2)访问线程信息
http://localhost:8015/monitor/threaddump
(3)HeapDump接口
自动生成Jvm的堆转储文件HeapDump,可以使用监控工具 VisualVM 打开此文件查看内存快照。
http://localhost:8015/monitor/headdump
(4)health
health 主要用来检查应用的运行状态
http://localhost:8015/monitor/health
{

    "status":"UP","components":
{

    "diskSpace":
{

    "status":"UP","details":
{

    "total":149264121856,
"free":78478319616,
"threshold":10485760,
"exists":true}},
"ping":{

    "status":"UP"}}}
(5)Mappings接口
描述请求映射信息
http://localhost:8015/monitor/mappings
{

    "contexts":{


"springboot-actuator":
{

    "mappings":
{

    "dispatcherServlets":
{

    "dispatcherServlet":
[{

    "handler":"Actuator web endpoint 'health'",
"predicate":
"{

    GET [/monitor/health], produces
(6)Beans接口
展示了 bean 的类型、单例多例、别名、类的全路径、依赖Jar等内容。
http://localhost:8015/monitor/beans
(7)Conditions接口
查看配置在什么条件下有效,或者自动配置为什么无效。
http://localhost:8015/monitor/conditions
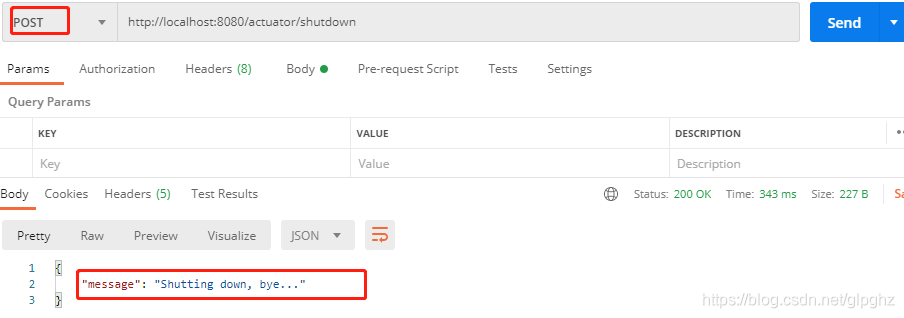
(8)ShutDown接口
优雅关闭 Spring Boot 应用,默认只支持POST请求
以 POST 的方式访问:http://localhost:8015/monitor/shutdown