版权声明:本文为博主原创文章,未经博主允许不得转载。 https://blog.csdn.net/qq_21816375/article/details/82657278
wget https://github.com/coreos/prometheus-operator/archive/v0.23.2.tar.gz
tar -zvxf v0.23.2.tar.gz

[root@master-47-35 operator]# ls -l
total 34676
drwxrwxr-x 14 root root     4096 Sep  6 10:12 prometheus-operator-0.23.2
-rw-r--r--  1 root root 35500525 Sep  5 18:05 v0.23.2.tar.gz
部署prometheus-operator的deployment
[root@master-47-35 prometheus-operator-0.23.2]# ls -l
total 156
-rw-rw-r--  1 root root  2444 Sep  6 09:37 bundle.yaml
-rw-rw-r--  1 root root 16313 Aug 23 20:54 CHANGELOG.md
drwxrwxr-x  7 root root  4096 Aug 23 20:54 cmd
-rw-rw-r--  1 root root  3039 Aug 23 20:54 code-of-conduct.md
drwxrwxr-x  3 root root  4096 Aug 23 20:54 contrib
-rw-rw-r--  1 root root  2668 Aug 23 20:54 CONTRIBUTING.md
-rw-rw-r--  1 root root  1422 Aug 23 20:54 DCO
-rw-rw-r--  1 root root   147 Aug 23 20:54 Dockerfile
drwxrwxr-x  3 root root  4096 Aug 23 20:54 Documentation
drwxrwxr-x 11 root root  4096 Aug 23 20:54 example
-rw-rw-r--  1 root root 22223 Aug 23 20:54 Gopkg.lock
-rw-rw-r--  1 root root  1468 Aug 23 20:54 Gopkg.toml
drwxrwxr-x  3 root root  4096 Aug 23 20:54 hack
drwxrwxr-x 17 root root  4096 Aug 23 20:54 helm
drwxrwxr-x  3 root root  4096 Aug 23 20:54 jsonnet
-rw-rw-r--  1 root root 11325 Aug 23 20:54 LICENSE
-rw-rw-r--  1 root root  9479 Aug 23 20:54 Makefile
-rw-rw-r--  1 root root   126 Aug 23 20:54 NOTICE
-rw-rw-r--  1 root root    88 Aug 23 20:54 OWNERS
drwxrwxr-x  8 root root  4096 Aug 23 20:54 pkg
-rw-rw-r--  1 root root  6108 Aug 23 20:54 README.md
-rw-rw-r--  1 root root  2953 Aug 23 20:54 RELEASE.md
drwxrwxr-x  3 root root  4096 Aug 23 20:54 scripts
drwxrwxr-x  5 root root  4096 Aug 23 20:54 test
drwxrwxr-x  6 root root  4096 Aug 23 20:54 vendor
-rw-rw-r-- 1 root root 7 Aug 23 20:54 VERSION根据这个提示,相关链接prometheus-operator
Note: make sure to adapt the namespace in the ClusterRoleBinding if deploying in another namespace than the default namespace.修改bundle.yaml文件,把空间改为monitoring
[root@master-47-35 prometheus-operator-0.23.2]# cat bundle.yaml
apiVersion: rbac.authorization.k8s.io/v1
kind: ClusterRoleBinding
metadata:
  name: prometheus-operator
roleRef:
  apiGroup: rbac.authorization.k8s.io
  kind: ClusterRole
  name: prometheus-operator
subjects:
- kind: ServiceAccount
  name: prometheus-operator
  namespace: monitoring
---
apiVersion: rbac.authorization.k8s.io/v1
kind: ClusterRole
metadata:
  name: prometheus-operator
rules:
- apiGroups:
  - apiextensions.k8s.io
  resources:
  - customresourcedefinitions
  verbs:
  - '*'
- apiGroups:
  - monitoring.coreos.com
  resources:
  - alertmanagers
  - prometheuses
  - prometheuses/finalizers
  - alertmanagers/finalizers
  - servicemonitors
  - prometheusrules
  verbs:
  - '*'
- apiGroups:
  - apps
  resources:
  - statefulsets
  verbs:
  - '*'
- apiGroups:
  - ""
  resources:
  - configmaps
  - secrets
  verbs:
  - '*'
- apiGroups:
  - ""
  resources:
  - pods
  verbs:
  - list
  - delete
- apiGroups:
  - ""
  resources:
  - services
  - endpoints
  verbs:
  - get
  - create
  - update
- apiGroups:
  - ""
  resources:
  - nodes
  verbs:
  - list
  - watch
- apiGroups:
  - ""
  resources:
  - namespaces
  verbs:
  - list
  - watch
---
apiVersion: apps/v1beta2
kind: Deployment
metadata:
  labels:
    k8s-app: prometheus-operator
  name: prometheus-operator
  namespace: monitoring
spec:
  replicas: 1
  selector:
    matchLabels:
      k8s-app: prometheus-operator
  template:
    metadata:
      labels:
        k8s-app: prometheus-operator
    spec:
      containers:
      - args:
        - --kubelet-service=kube-system/kubelet
        - --logtostderr=true
        - --config-reloader-image=quay.io/coreos/configmap-reload:v0.0.1
        - --prometheus-config-reloader=quay.io/coreos/prometheus-config-reloader:v0.23.2
        image: quay.io/coreos/prometheus-operator:v0.23.2
        name: prometheus-operator
        ports:
        - containerPort: 8080
          name: http
        resources:
          limits:
            cpu: 200m
            memory: 200Mi
          requests:
            cpu: 100m
            memory: 100Mi
        securityContext:
          allowPrivilegeEscalation: false
          readOnlyRootFilesystem: true
      nodeSelector:
        beta.kubernetes.io/os: linux
      securityContext:
        runAsNonRoot: true
        runAsUser: 65534
      serviceAccountName: prometheus-operator
---
apiVersion: v1
kind: ServiceAccount
metadata:
  name: prometheus-operator
  namespace: monitoring
部署
kubectl create -f bundle.yaml 部署kube-prometheus
[root@master-47-35 manifests]# pwd
/opt/ssl/prometheus/operator/prometheus-operator-0.23.2/contrib/kube-prometheus/manifests
[root@master-47-35 manifests]# kubectl create -f .
查看结果
[root@master-47-35 manifests]# kubectl get all -n monitoring
NAME                                       READY     STATUS    RESTARTS   AGE
pod/alertmanager-main-0                    2/2       Running   0          6d
pod/alertmanager-main-1                    2/2       Running   0          4d
pod/alertmanager-main-2                    2/2       Running   2          6d
pod/grafana-8668cff847-xxrsd               1/1       Running   1          4d
pod/kube-state-metrics-5b7b6c5dcd-pxxkb    4/4       Running   4          6d
pod/node-exporter-275cv                    2/2       Running   2          6d
pod/node-exporter-bkdwx                    2/2       Running   0          6d
pod/node-exporter-h6hb7                    2/2       Running   2          6d
pod/node-exporter-hgs5j                    2/2       Running   0          6d
pod/node-exporter-r4l7r                    2/2       Running   0          6d
pod/prometheus-k8s-0                       3/3       Running   4          6d
pod/prometheus-k8s-1                       3/3       Running   4          6d
pod/prometheus-operator-6b574898c9-65t9j   1/1       Running   0          6d

NAME                            TYPE        CLUSTER-IP      EXTERNAL-IP   PORT(S)             AGE
service/alertmanager-main       NodePort    10.254.29.142   <none>        9093:31306/TCP      6d
service/alertmanager-operated   ClusterIP   None            <none>        9093/TCP,6783/TCP   6d
service/grafana                 NodePort    10.254.6.157    <none>        3000:30986/TCP      6d
service/kube-state-metrics      ClusterIP   None            <none>        8443/TCP,9443/TCP   6d
service/node-exporter           ClusterIP   None            <none>        9100/TCP            6d
service/prometheus-k8s          NodePort    10.254.28.78    <none>        9090:31399/TCP      6d
service/prometheus-operated     ClusterIP   None            <none>        9090/TCP            6d
service/prometheus-operator     ClusterIP   None            <none>        8080/TCP            6d

NAME                           DESIRED   CURRENT   READY     UP-TO-DATE   AVAILABLE   NODE SELECTOR                 AGE
daemonset.apps/node-exporter   5         5         5         5            5           beta.kubernetes.io/os=linux   6d

NAME                                  DESIRED   CURRENT   UP-TO-DATE   AVAILABLE   AGE
deployment.apps/grafana               1         1         1            1           6d
deployment.apps/kube-state-metrics    1         1         1            1           6d
deployment.apps/prometheus-operator   1         1         1            1           6d

NAME                                             DESIRED   CURRENT   READY     AGE
replicaset.apps/grafana-8668cff847               1         1         1         6d
replicaset.apps/kube-state-metrics-5b7b6c5dcd    1         1         1         6d
replicaset.apps/kube-state-metrics-6dfc9b9844    0         0         0         6d
replicaset.apps/prometheus-operator-6b574898c9   1         1         1         6d

NAME                                 DESIRED   CURRENT   AGE
statefulset.apps/alertmanager-main   3         3         6d
statefulset.apps/prometheus-k8s      2         2         6d
修改访问方式
把svc的访问方式改为NodePort模式,使用kubectl edit svc svcname方式修改
[root@master-47-35 manifests]# kubectl get svc -n monitoring
NAME                    TYPE        CLUSTER-IP      EXTERNAL-IP   PORT(S)             AGE
alertmanager-main       NodePort    10.254.29.142   <none>        9093:31306/TCP      6d
alertmanager-operated   ClusterIP   None            <none>        9093/TCP,6783/TCP   6d
grafana                 NodePort    10.254.6.157    <none>        3000:30986/TCP      6d
kube-state-metrics      ClusterIP   None            <none>        8443/TCP,9443/TCP   6d
node-exporter           ClusterIP   None            <none>        9100/TCP            6d
prometheus-k8s          NodePort    10.254.28.78    <none>        9090:31399/TCP      6d
prometheus-operated     ClusterIP   None            <none>        9090/TCP            6d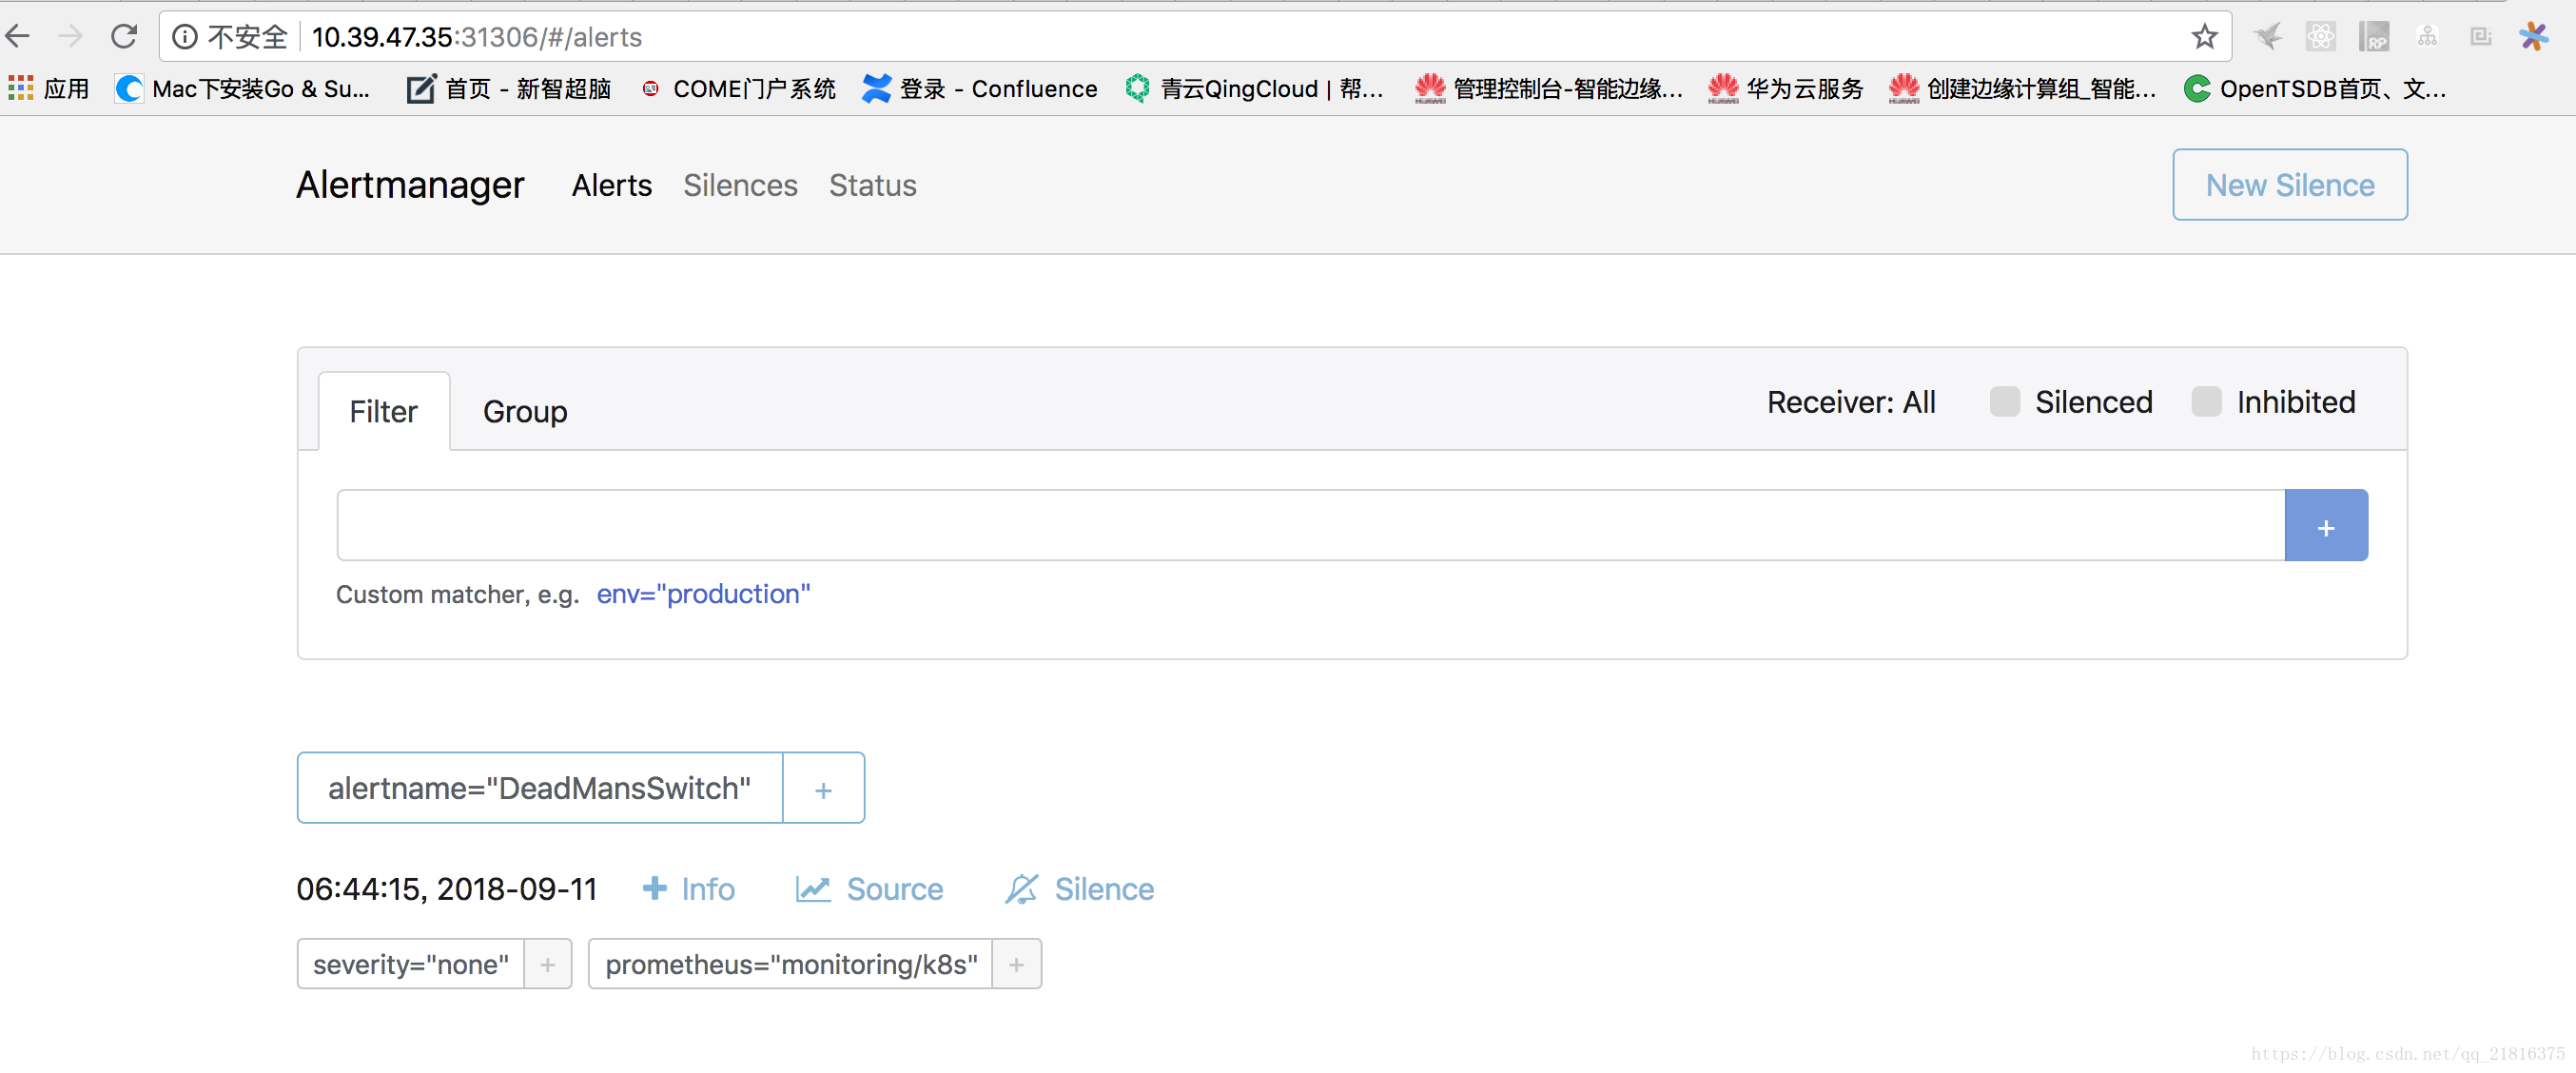
prometheus-operator ClusterIP None <none> 8080/TCP 6d访问alertmanager-main
https://masterIp:31306
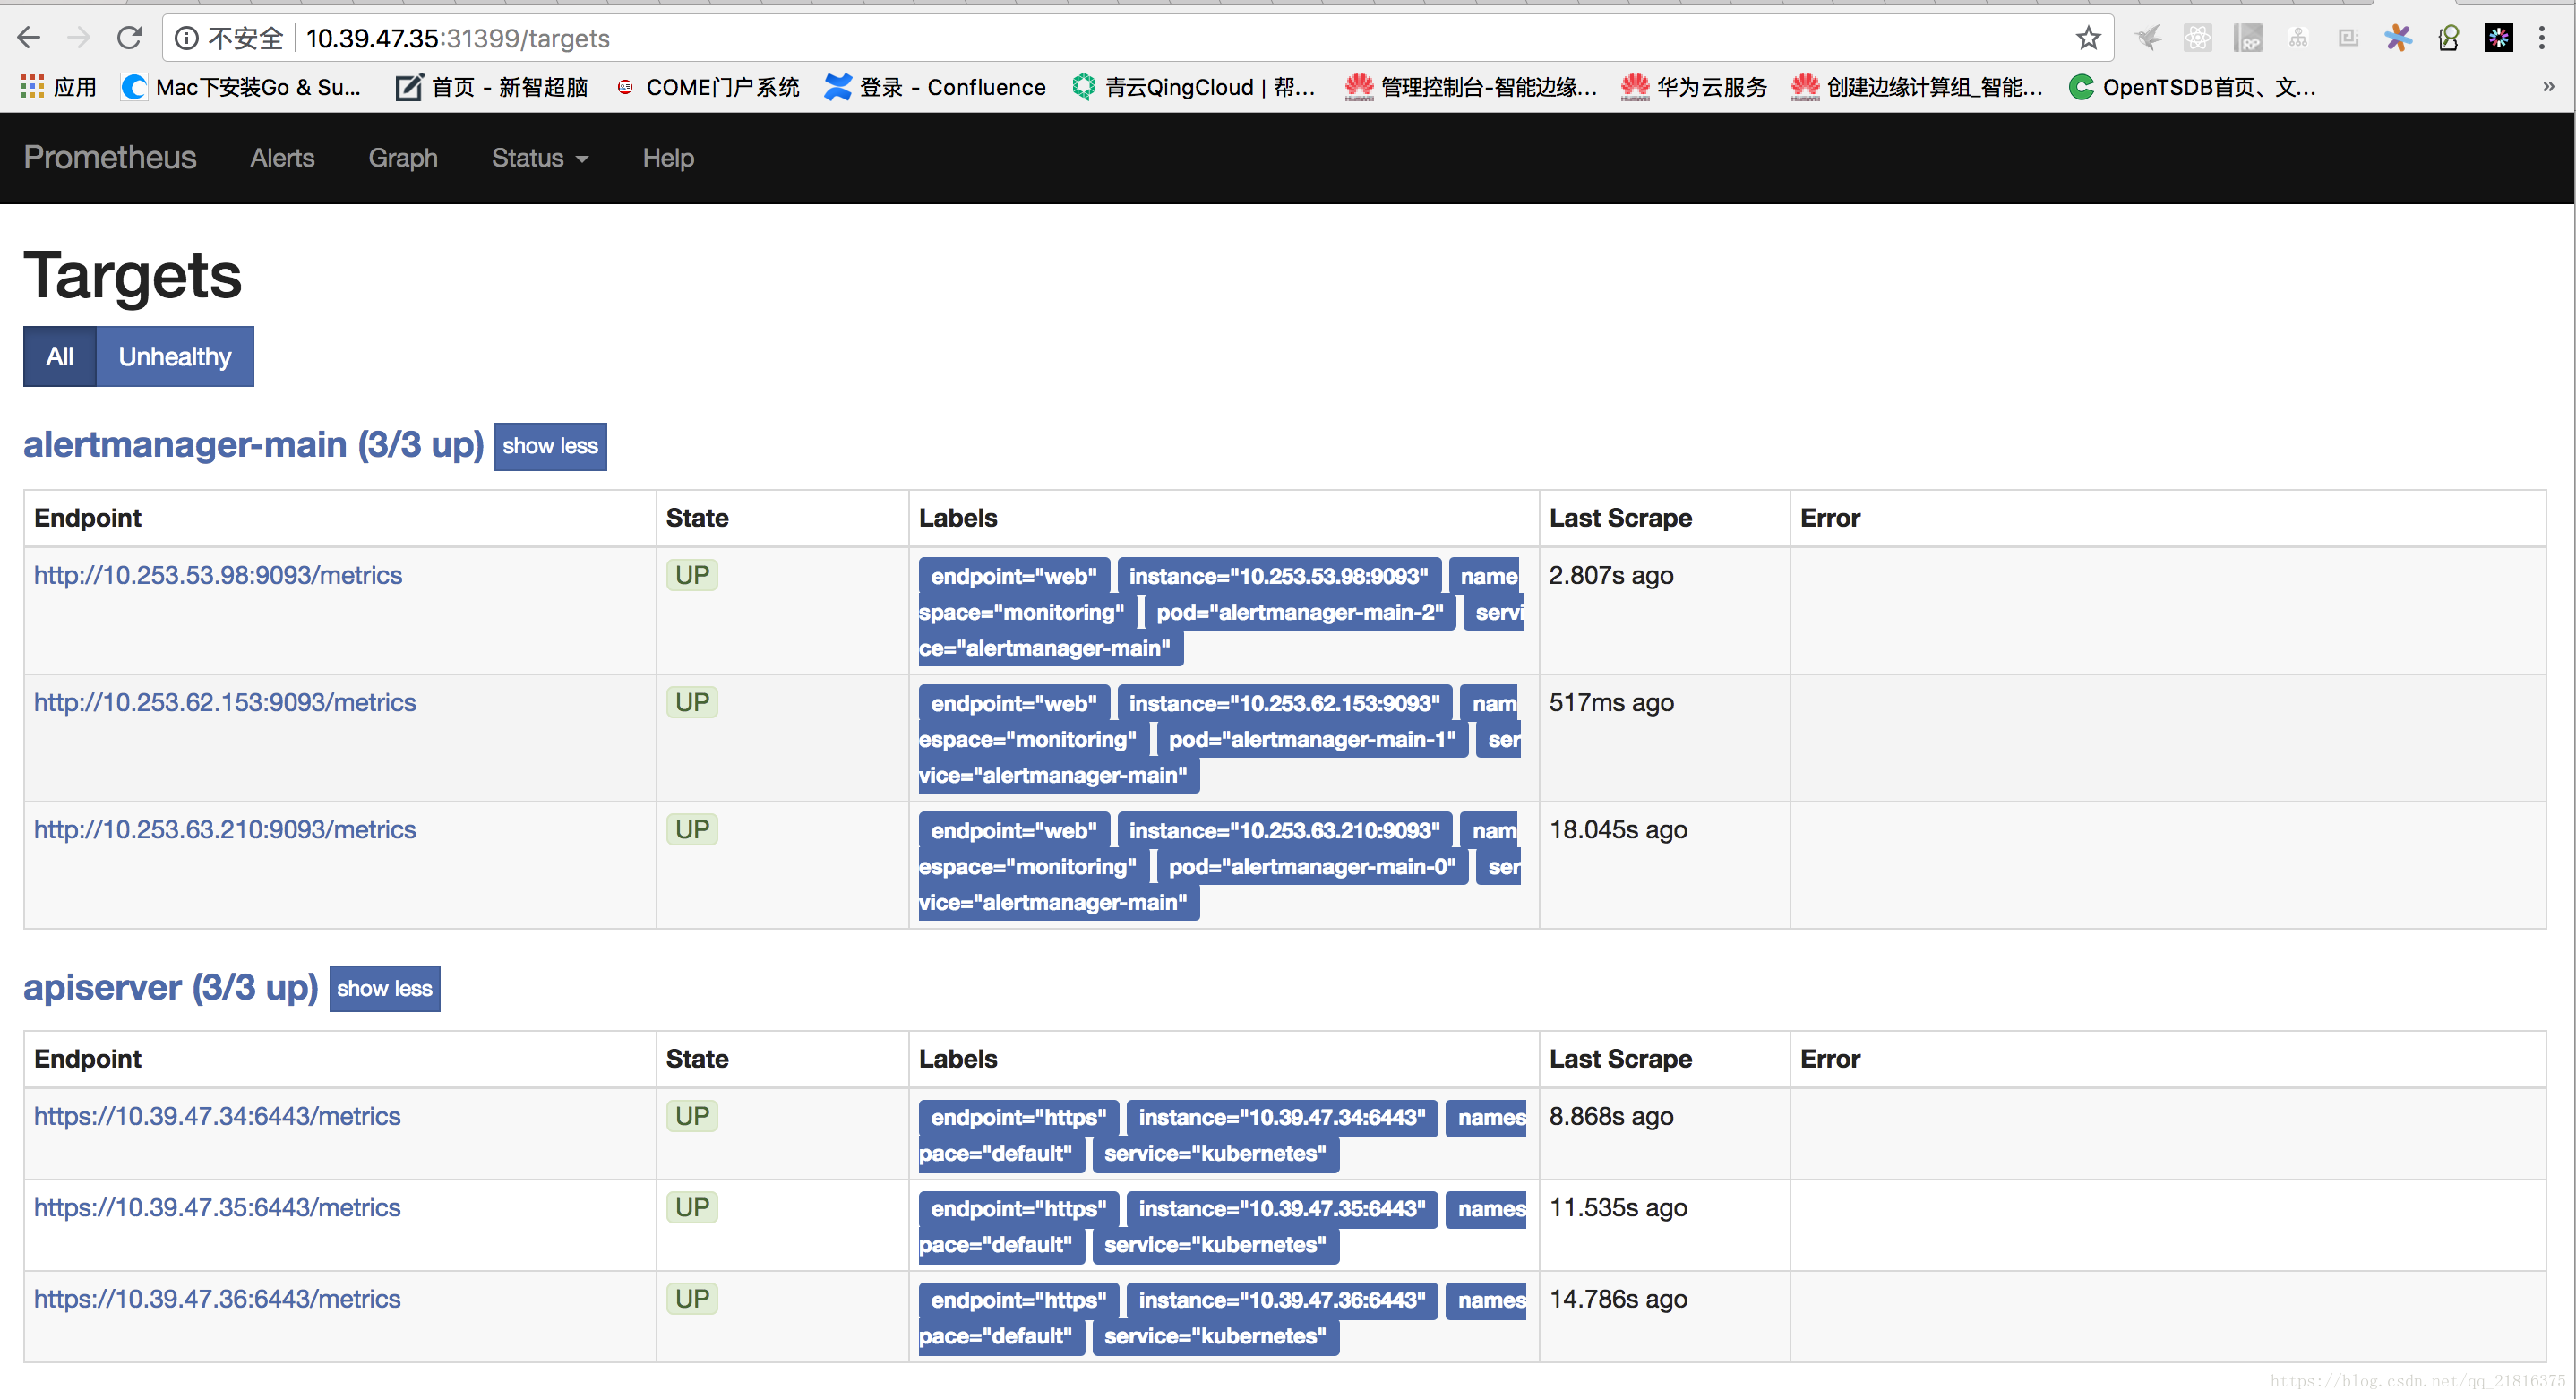
访问prometheus-k8s
扫描二维码关注公众号,回复:
3247347 查看本文章

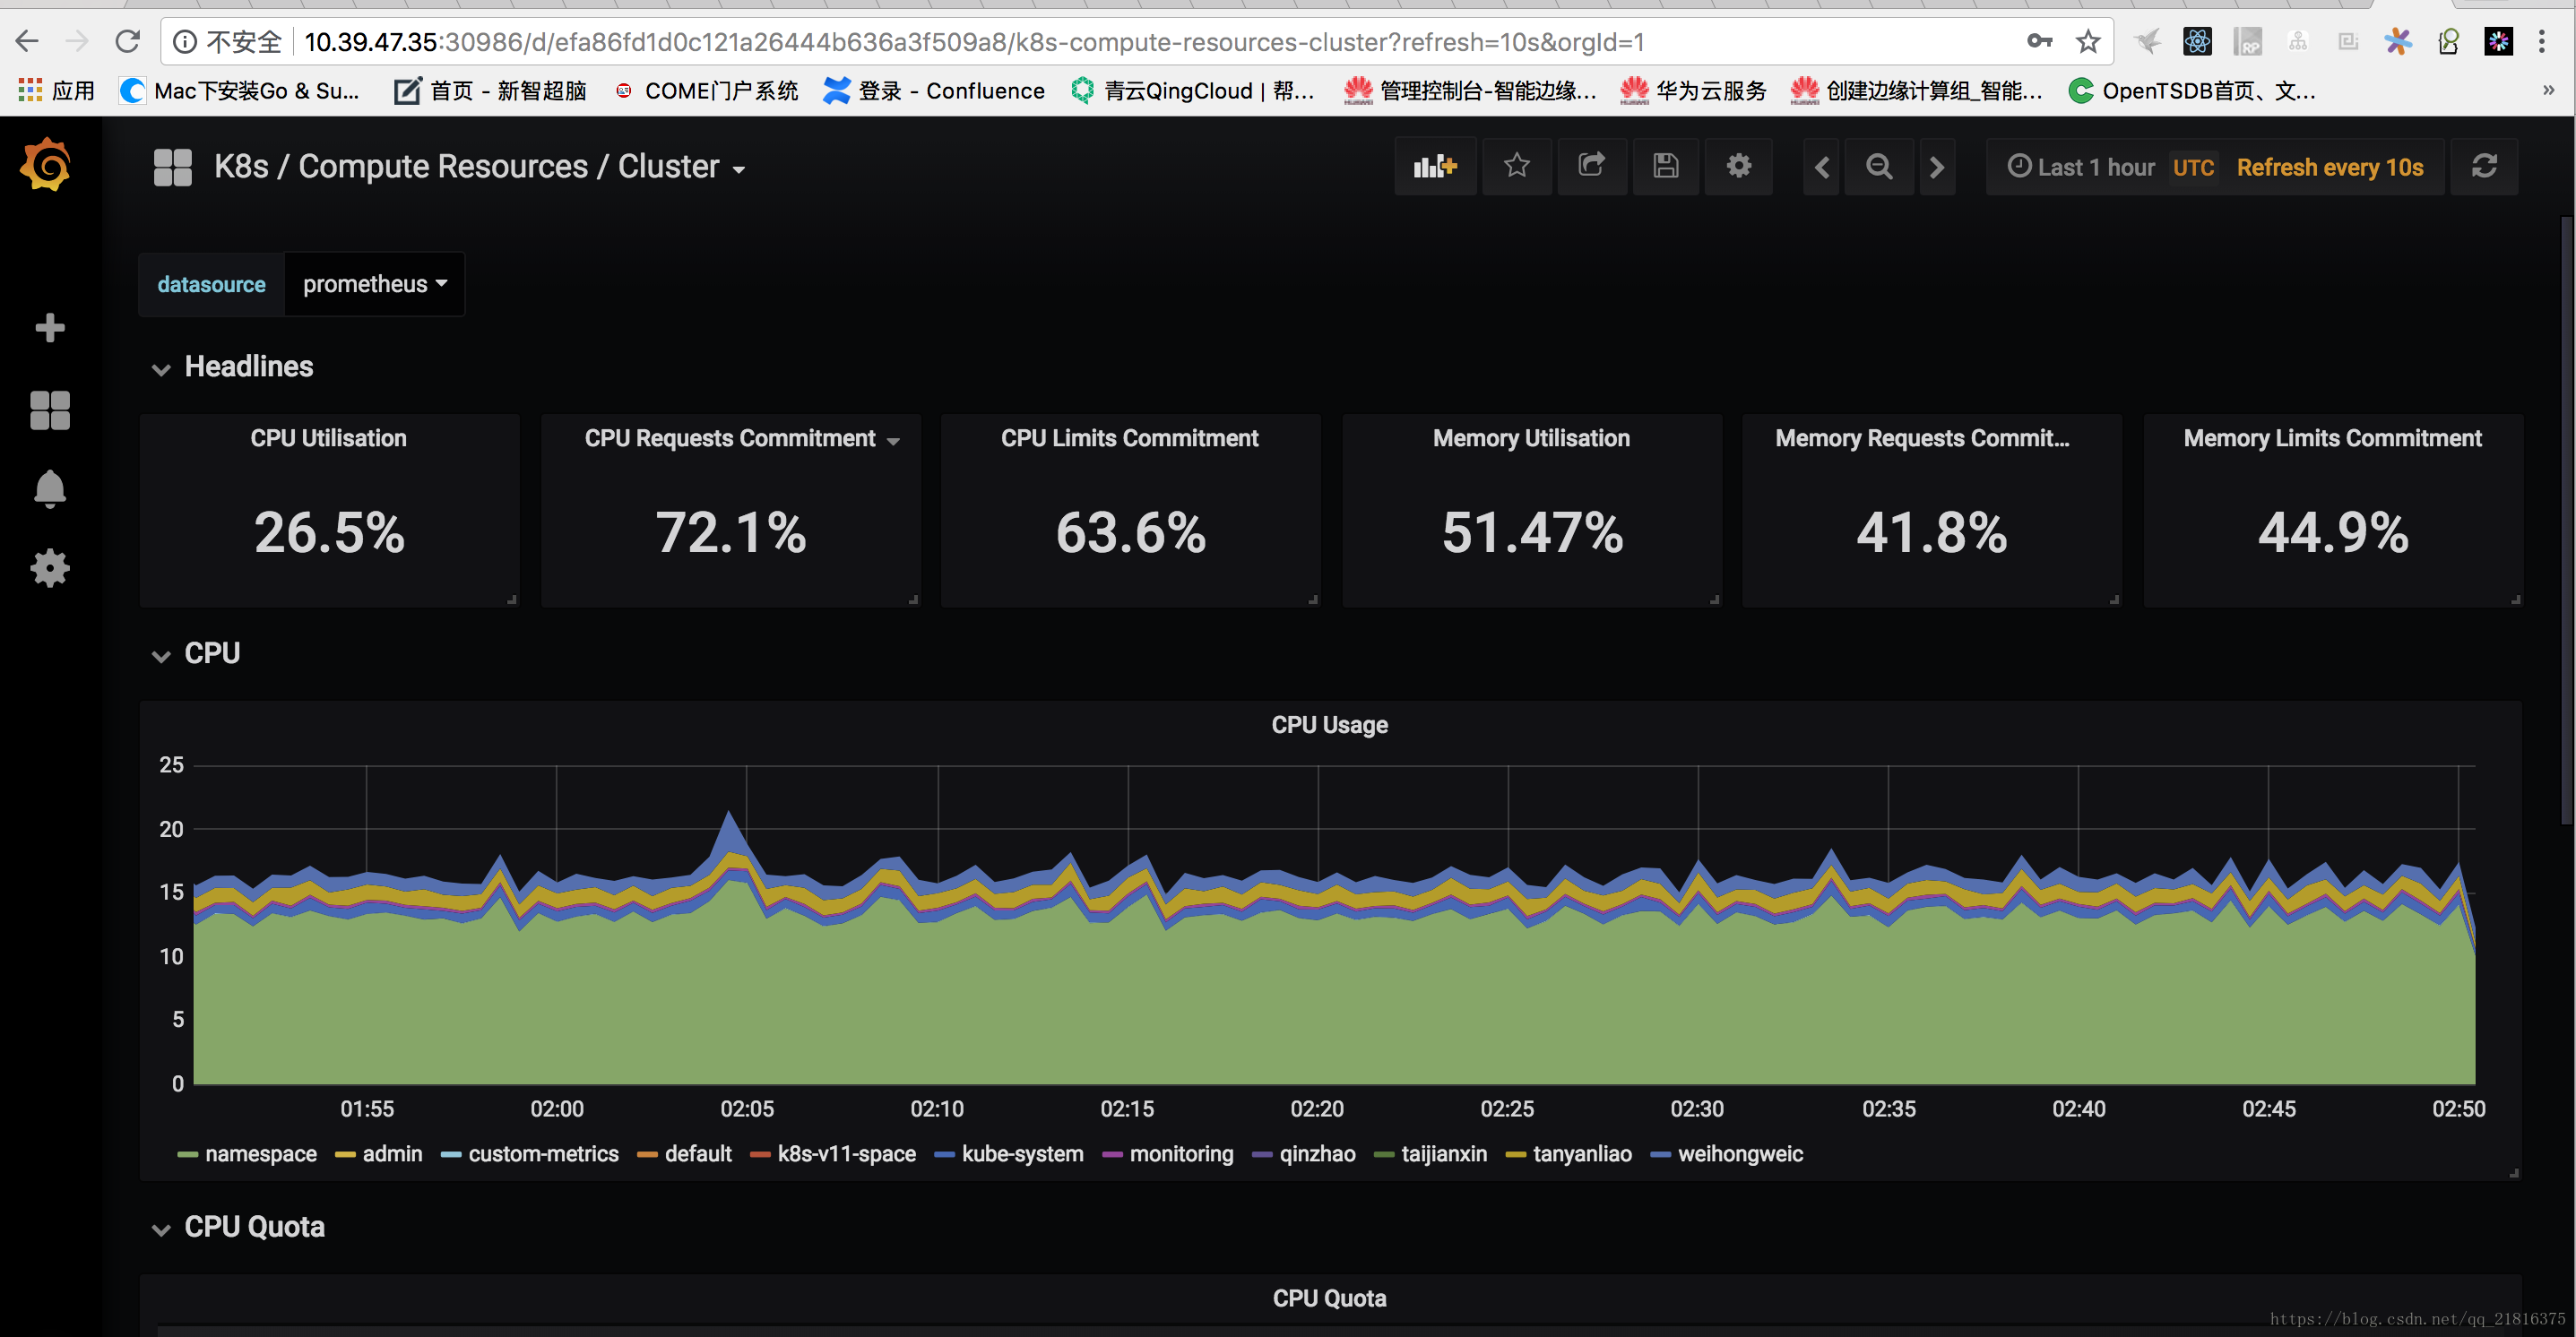
访问grafana
https://masterIp:30986
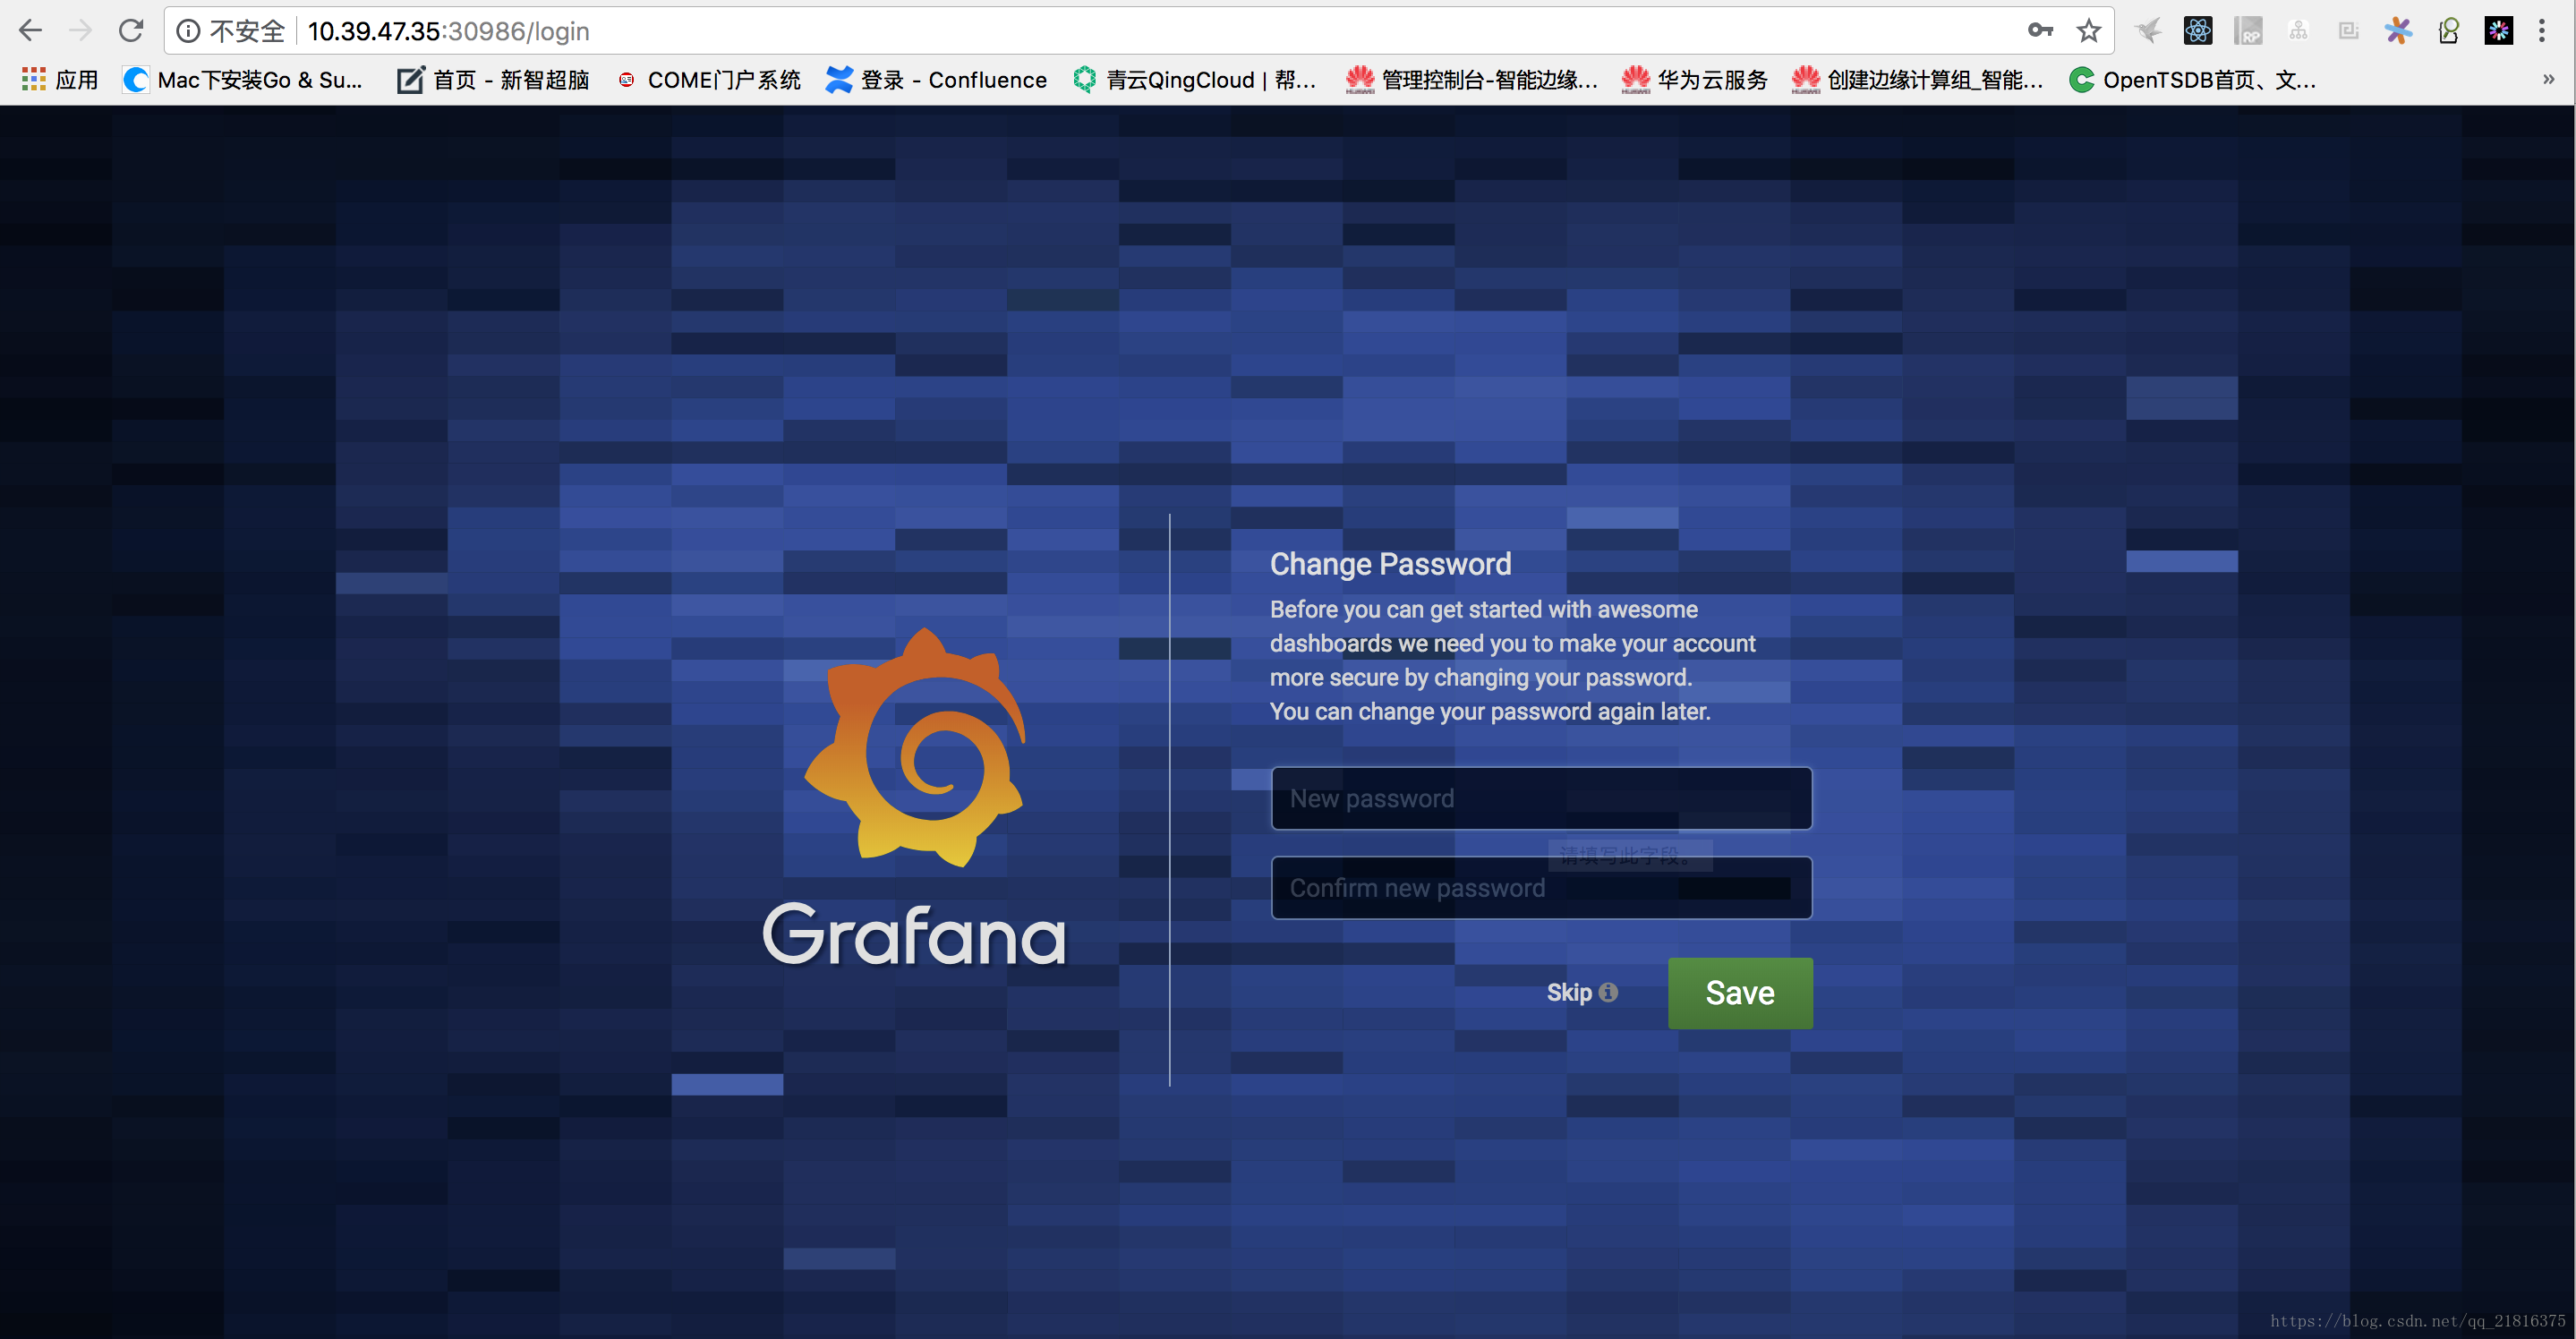
输入密码就可以了
参考
https://blog.csdn.net/qq_21816375/article/details/80755336