版权声明:本文为博主原创文章,未经博主允许不得转载。 https://blog.csdn.net/qq_33434901/article/details/79569982
本文分为三个大部分:一.程序结构 二.程序代码 三.运行结果
一.程序结构
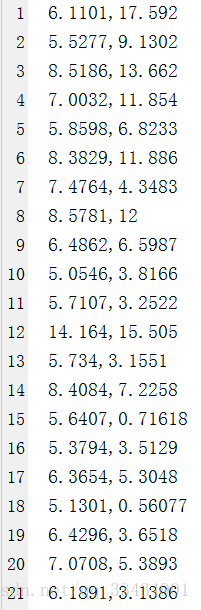
此实例有一个数据集sampleDataSets.txt,该数据集部分截图如下。其中,第一列为城市人口数量(单位:万人),第二列为对应的参考房价(单位:十万)。
LR_One_Var.m文件为主程序;CompCost.m文件为计算损失值得函数;GradDesc.m文件为梯度下降函数,用于寻找最优的θ;PlotData.m文件为描绘采集数据图像的函数。
二.程序代码
LR_One_Var.m文件代码如下。
%%%%%%%%%%%%%%%%%%%%绘图函数%%%%%%%%%%%%%%%%%%%%
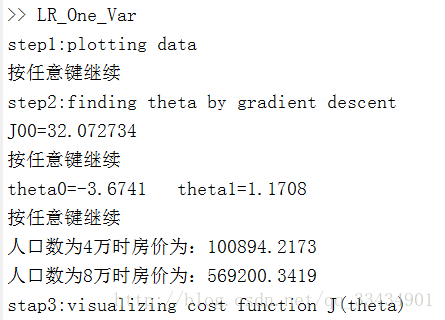
disp('step1:plotting data');
%1.导入采样数据
data=load('sampleDataSets.txt');%第一列是城市人口数,第二列是参考房价
%2.分配数据
X=data(:,1);%城市人口数(万人)
y=data(:,2);%参考房价(十万)
m=length(y);%数据长度
%3.绘图
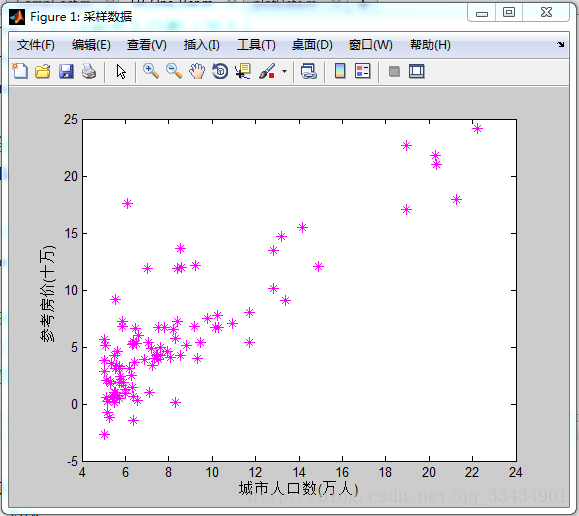
PlotData(X,y);
disp('按任意键继续');
pause;
%%%%%%%%%%%%%%%%%%%%梯度下降%%%%%%%%%%%%%%%%%%%%
disp('step2:finding theta by gradient descent');
%1.初始化及参数设置
X=[ones(m,1),data(:,1)];
theta=zeros(2,1);
iterations=1600;
alpha=0.01;
%2.计算成本
J00=CompCost(X,y,m,theta);
fprintf('J00=%f\n',J00);
disp('按任意键继续');
pause;
%3.梯度下降法求θ值
theta=GradDesc(X,y,m,theta,iterations,alpha);
disp(['theta0=',num2str(theta(1)),' theta1=',num2str(theta(2))]);
disp('按任意键继续');
pause;
%4.绘制线性回归方程
hold on
plot(X(:,2),X*theta)
legend('样本数据','一元线性回归');
%5.预测城市人口为4万、8万时的房价
predict1=[1 4]*theta;
predict2=[1 8]*theta;
disp(['人口数为4万时房价为:',num2str(predict1*100000)]);
disp(['人口数为8万时房价为:',num2str(predict2*100000)]);
%%%%%%%%%%%%%%%%%%%%成本函数%%%%%%%%%%%%%%%%%%%%
disp('stap3:visualizing cost function J(theta)');
%1.计算并记录成本函数
theta0_vals=linspace(-10,10,100);
theta1_vals=linspace(1,4,100);
J_vals=[];
for i=1:100
for j=1:100
t=[theta0_vals(i);theta1_vals(j)];
J_vals(i,j)=CompCost(X,y,m,t);
end
end
J_vals=J_vals';
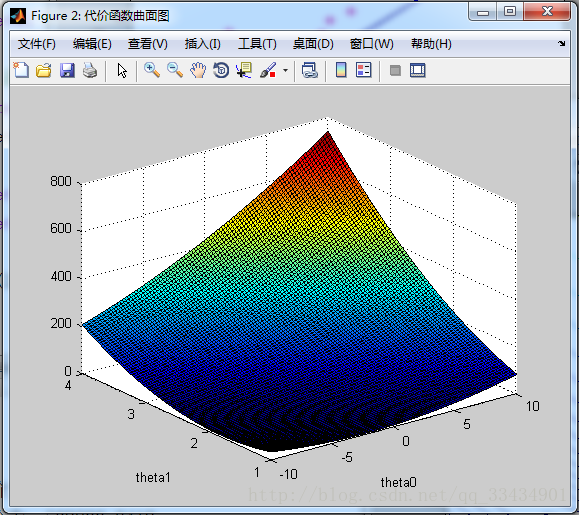
%2.绘制成本函数曲面图
figure('name','代价函数曲面图');
surf(theta0_vals,theta1_vals,J_vals);
xlabel('theta0');
ylabel('theta1');
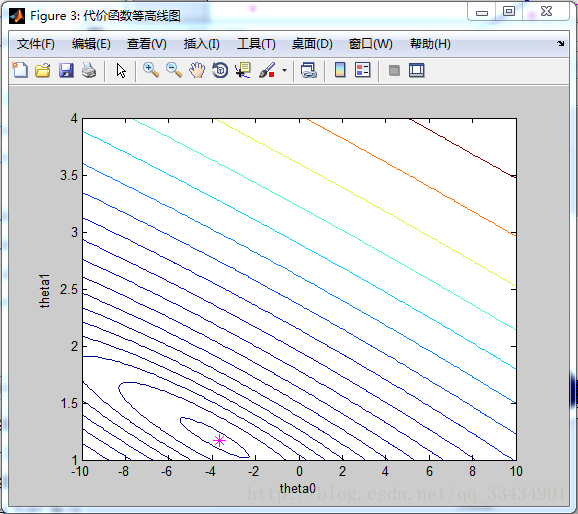
%3.绘制成本函数等高线图
figure('name','代价函数等高线图');
contour(theta0_vals,theta1_vals,J_vals,logspace(-3,3,50));%4.成本函数的值做对数处理
xlabel('theta0');
ylabel('theta1');
hold on;
plot(theta(1),theta(2),'m*','MarkerSize',10);
PlotData.m文件代码如下。
function plotData(X,y)

figure('name','采样数据');

plot(X,y,'m*','MarkerSize',8);
xlabel('城市人口数(万人)');
ylabel('参考房价(十万)');

end
CompCost.m文件代码如下。
function J=CompCost(X,y,m,theta)

sum=0;
for i=1:m
    h=X(i,:)*theta;
    sum=sum+(h-y(i))^2;
end
J=sum/(2*m);

end
GradDesc.m文件代码如下。
function theta= GradDesc( X,y,m,theta,iterations,alpha )

J_history=[];

for i=1:iterations
    sum=0;
    sumx=zeros(2,1);
    for j=1:m
        sum=(X(j,:)*theta-y(j));
        sumx=sumx+X(j,:)'*sum;
    end
    theta=theta-(alpha/m)*sumx;
    J_history(i)=CompCost(X,y,m,theta);
    if i>1&&J_history(i)<=min(J_history)
        theta_p=theta;
    end
end
theta=theta_p;

end
三.运行结果
1.采集数据样本图像:
2.线性回归函数图像

3.代价函数曲面图:
4.代价函数等高线图:
5.控制台输出截图:
(完)