使用ab进行对web服务器压力测试:
- 前言:
当我们部署完一台web服务器之后,想要知道的这台服务器的性能。就要知道他的吞吐率和响应时间分别是多少,怎么看呢?那就需要对它进行压力测试。
1)吞吐率/响应时间:requests/sec;
2)压力测试:使用ab工具进行测试;
前置条件:支持多少用户,支持多少访问,支持多少并发。
约定:a、1用户--》1请求。b、测试多次的平均值。c、测试时尽量选择只运行单web进程做测试。d、场景,就是资源大小。
测试时:总共请求多少次。并发多少。
二、准备环境:
使用上上章安装apache的环境,这里就不再详细介绍。不懂请看(7、高性能web架构之Apche使用虚拟主机实现反向代理 )
1、首先我们来配置压力测试的web页面:
[root@linux-node6 ~]# vi /usr/local/httpd/conf/httpd.conf //主配置文件添加下面这几行
<Location /server-status>
SetHandler server-status
# Order deny,allow
# Deny from all
# Allow from 192.168.10.106
</Location>
注意:需要强调的是,用户开启状态,注意设置Allow From,以免造成敏感信息的泄漏。
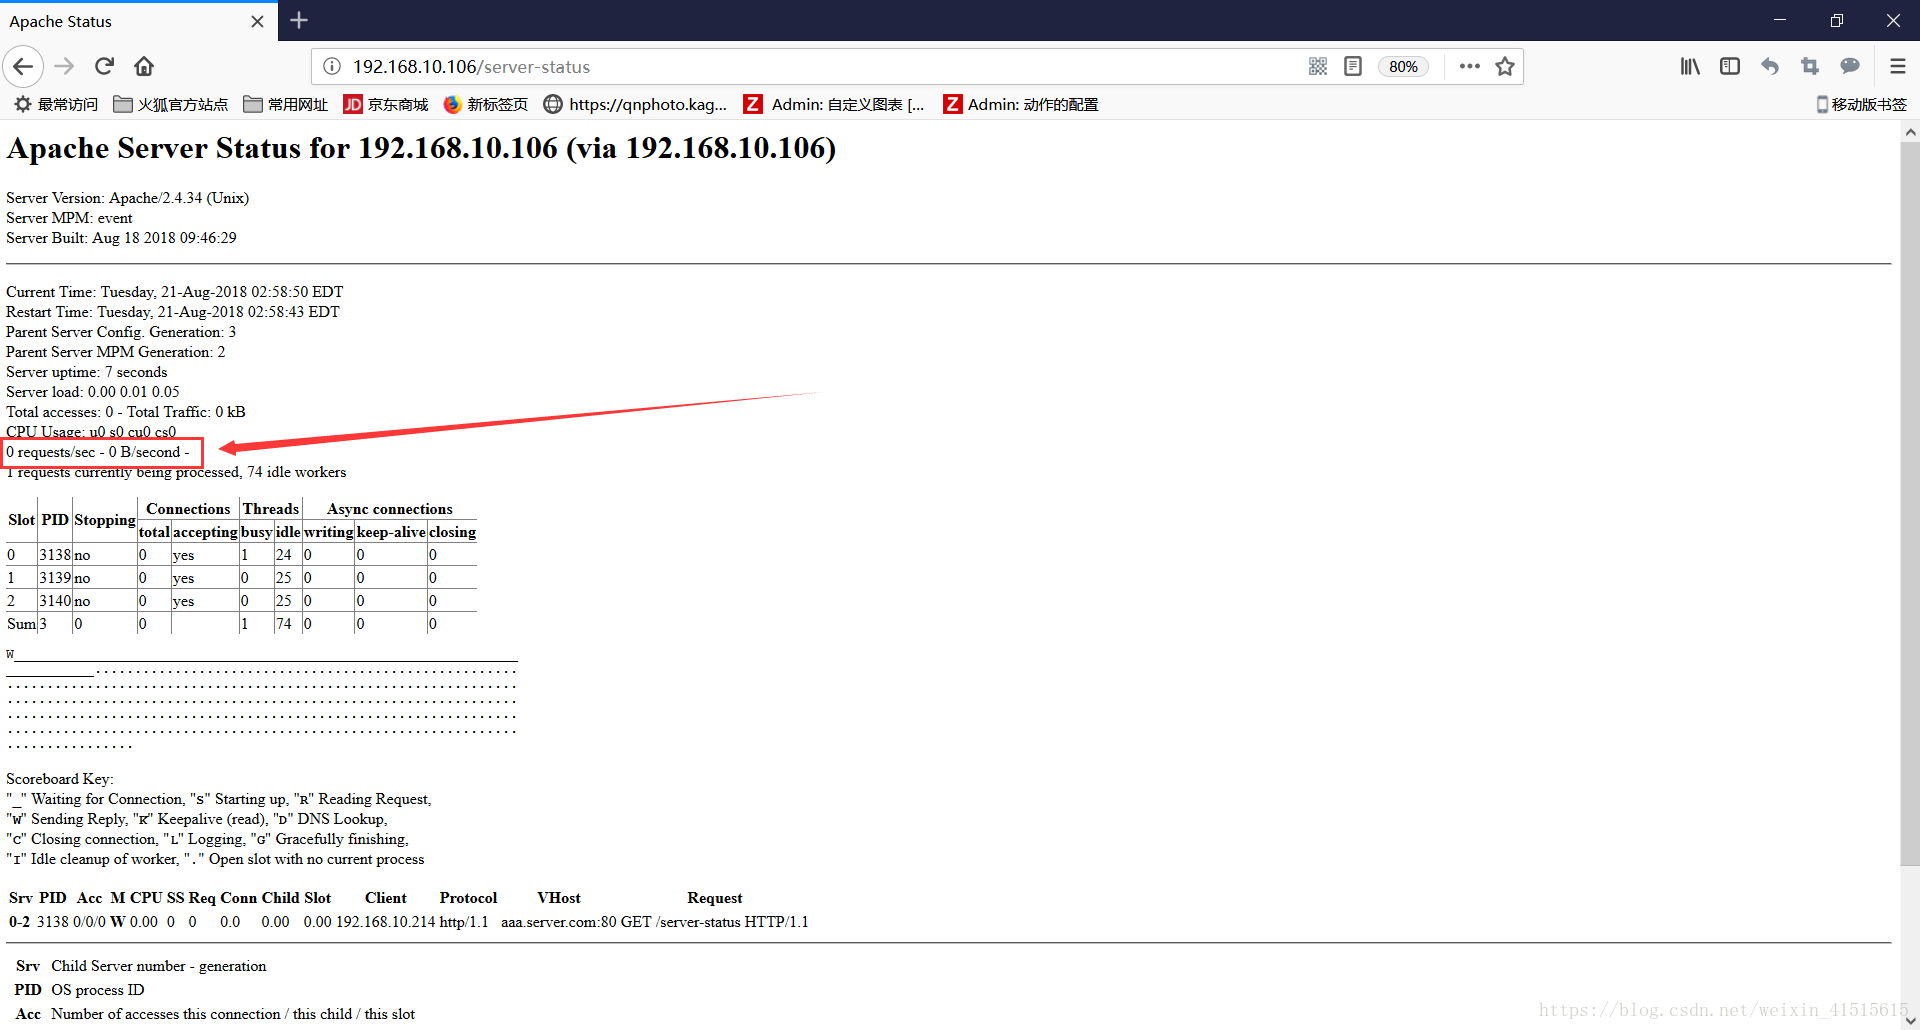
2、访问一下http://192.168.10.106/server-status:
- ab使用的安装包:
[root@linux-node6 ~]# rpm -qa httpd-tools //没有则安装
[root@linux-node6 ~]# yum -y install httpd-tools
[root@linux-node6 ~]# rpm -qa httpd-tools
httpd-tools-2.4.6-80.el7.centos.1.x86_64
[root@linux-node6 ~]#
[root@linux-node6 ~]# ab --help //不懂使用就help
ab: wrong number of arguments
Usage: ab [options] [http[s]://]hostname[:port]/path
Options are:
-n requests Number of requests to perform
-c concurrency Number of multiple requests to make at a time
-t timelimit Seconds to max. to spend on benchmarking
This implies -n 50000
-s timeout Seconds to max. wait for each response
Default is 30 seconds
-b windowsize Size of TCP send/receive buffer, in bytes
-B address Address to bind to when making outgoing connections
-p postfile File containing data to POST. Remember also to set -T
-u putfile File containing data to PUT. Remember also to set -T
-T content-type Content-type header to use for POST/PUT data, eg.
'application/x-www-form-urlencoded'
Default is 'text/plain'
-v verbosity How much troubleshooting info to print
-w Print out results in HTML tables
-i Use HEAD instead of GET
-x attributes String to insert as table attributes
-y attributes String to insert as tr attributes
-z attributes String to insert as td or th attributes
-C attribute Add cookie, eg. 'Apache=1234'. (repeatable)
-H attribute Add Arbitrary header line, eg. 'Accept-Encoding: gzip'
Inserted after all normal header lines. (repeatable)
-A attribute Add Basic WWW Authentication, the attributes
are a colon separated username and password.
-P attribute Add Basic Proxy Authentication, the attributes
are a colon separated username and password.
-X proxy:port Proxyserver and port number to use
-V Print version number and exit
-k Use HTTP KeepAlive feature
-d Do not show percentiles served table.
-S Do not show confidence estimators and warnings.
-q Do not show progress when doing more than 150 requests
-g filename Output collected data to gnuplot format file.
-e filename Output CSV file with percentages served
-r Don't exit on socket receive errors.
-h Display usage information (this message)
-Z ciphersuite Specify SSL/TLS cipher suite (See openssl ciphers)
-f protocol Specify SSL/TLS protocol
(SSL3, TLS1, TLS1.1, TLS1.2 or ALL)
三、进行测试:
1、ab的测试:
[root@linux-node6 ~]# ab -n 10000 -c 100 http://192.168.10.106:80/
This is ApacheBench, Version 2.3 <$Revision: 1430300 $>
Copyright 1996 Adam Twiss, Zeus Technology Ltd, http://www.zeustech.net/
Licensed to The Apache Software Foundation, http://www.apache.org/
Benchmarking 192.168.10.106 (be patient)
Completed 1000 requests
Completed 2000 requests
Completed 3000 requests
Completed 4000 requests
Completed 5000 requests
Completed 6000 requests
Completed 7000 requests
Completed 8000 requests
Completed 9000 requests
Completed 10000 requests
Finished 10000 requests
Server Software: Apache/2.4.34 《=====apache版本
Server Hostname: 192.168.10.106《=====主机名称
Server Port: 80 《====端口
Document Path: /
Document Length: 381 bytes
Concurrency Level: 100 《=======并发
Time taken for tests: 0.793 seconds 《====所以请求完所花费的时间
Complete requests: 10000 《=====总请求数
Failed requests: 0 《===========失败的请求数
Write errors: 0
Non-2xx responses: 10000
Total transferred: 6080000 bytes 《======所有响应数据正文的总和(包括响应头)
HTML transferred: 3810000 bytes 《=======所有响应数据正文的总和(不包括响应头)
Requests per second: 12607.96 [#/sec] (mean)《=====吞吐率(所有的请求除花费的时间10000/0.793)
Time per request: 7.931 [ms] (mean)《====平均用户请求等待时间
Time per request: 0.079 [ms] (mean, across all concurrent requests)《===平均请求处理时间
Transfer rate: 7485.97 [Kbytes/sec] received 《===每秒从服务器获取的长度
Connection Times (ms)
min mean[+/-sd] median max
Connect: 0 1 0.3 1 3
Processing: 3 7 2.1 7 23
Waiting: 1 6 2.0 6 22
Total: 3 8 2.1 8 25
Percentage of the requests served within a certain time (ms)
50% 8
66% 8
75% 8
80% 8
90% 9
95% 11
98% 12
99% 25
100% 25 (longest request)
注意:-n代表总请求数,-c代表并发。

2、为了看到效果,我们将页面调大再测试:
[root@linux-node6 ~]# vi /usr/local/httpd/htdocs/aaa/index.html //多条件几行内容
<h1>aaa.server.com</h1>
<h1>aaa.server.com</h1>
<h1>aaa.server.com</h1>
<h1>aaa.server.com</h1>
<h1>aaa.server.com</h1>
<h1>aaa.server.com</h1>
[root@linux-node6 ~]# ll /usr/local/httpd/htdocs/aaa/index.html
-rw-r--r-- 1 root root 2424 Aug 21 03:25 /usr/local/httpd/htdocs/aaa/index.html
[root@linux-node6 ~]# ab -n 10000 -c 100 http://192.168.10.106:80/ 《==并发100
This is ApacheBench, Version 2.3 <$Revision: 1430300 $>
Copyright 1996 Adam Twiss, Zeus Technology Ltd, http://www.zeustech.net/
Licensed to The Apache Software Foundation, http://www.apache.org/
Benchmarking 192.168.10.106 (be patient)
Completed 1000 requests
Completed 2000 requests
Completed 3000 requests
Completed 4000 requests
Completed 5000 requests
Completed 6000 requests
Completed 7000 requests
Completed 8000 requests
Completed 9000 requests
Completed 10000 requests
Finished 10000 requests
Server Software: Apache/2.4.34
Server Hostname: 192.168.10.106
Server Port: 80
Document Path: /
Document Length: 381 bytes
Concurrency Level: 100
Time taken for tests: 0.808 seconds
Complete requests: 10000
Failed requests: 0
Write errors: 0
Non-2xx responses: 10000
Total transferred: 6080000 bytes
HTML transferred: 3810000 bytes
Requests per second: 12372.69 [#/sec] (mean)
Time per request: 8.082 [ms] (mean)
Time per request: 0.081 [ms] (mean, across all concurrent requests)
Transfer rate: 7346.28 [Kbytes/sec] received
Connection Times (ms)
min mean[+/-sd] median max
Connect: 0 1 1.9 1 24
Processing: 4 7 1.2 7 18
Waiting: 2 6 1.1 6 18
Total: 5 8 2.7 8 37
Percentage of the requests served within a certain time (ms)
50% 8
66% 8
75% 8
80% 8
90% 8
95% 8
98% 14
99% 26
100% 37 (longest request)
[root@linux-node6 ~]# ab -n 10000 -c 150 http://192.168.10.106:80/ 《==并发150
This is ApacheBench, Version 2.3 <$Revision: 1430300 $>
Copyright 1996 Adam Twiss, Zeus Technology Ltd, http://www.zeustech.net/
Licensed to The Apache Software Foundation, http://www.apache.org/
Benchmarking 192.168.10.106 (be patient)
Completed 1000 requests
Completed 2000 requests
Completed 3000 requests
Completed 4000 requests
Completed 5000 requests
Completed 6000 requests
Completed 7000 requests
Completed 8000 requests
Completed 9000 requests
Completed 10000 requests
Finished 10000 requests
Server Software: Apache/2.4.34
Server Hostname: 192.168.10.106
Server Port: 80
Document Path: /
Document Length: 381 bytes
Concurrency Level: 150
Time taken for tests: 0.854 seconds
Complete requests: 10000
Failed requests: 0
Write errors: 0
Non-2xx responses: 10000
Total transferred: 6080000 bytes
HTML transferred: 3810000 bytes
Requests per second: 11707.87 [#/sec] (mean)
Time per request: 12.812 [ms] (mean)
Time per request: 0.085 [ms] (mean, across all concurrent requests)
Transfer rate: 6951.55 [Kbytes/sec] received
Connection Times (ms)
min mean[+/-sd] median max
Connect: 0 2 1.4 1 21
Processing: 3 11 18.2 9 210
Waiting: 1 10 18.1 8 208
Total: 4 12 18.2 10 211
Percentage of the requests served within a certain time (ms)
50% 10
66% 10
75% 10
80% 11
90% 12
95% 13
98% 24
99% 35
100% 211 (longest request)
[root@linux-node6 ~]# ab -n 10000 -c 80 http://192.168.10.106:80/ 《==并发80
This is ApacheBench, Version 2.3 <$Revision: 1430300 $>
Copyright 1996 Adam Twiss, Zeus Technology Ltd, http://www.zeustech.net/
Licensed to The Apache Software Foundation, http://www.apache.org/
Benchmarking 192.168.10.106 (be patient)
Completed 1000 requests
Completed 2000 requests
Completed 3000 requests
Completed 4000 requests
Completed 5000 requests
Completed 6000 requests
Completed 7000 requests
Completed 8000 requests
Completed 9000 requests
Completed 10000 requests
Finished 10000 requests
Server Software: Apache/2.4.34
Server Hostname: 192.168.10.106
Server Port: 80
Document Path: /
Document Length: 381 bytes
Concurrency Level: 80
Time taken for tests: 0.776 seconds
Complete requests: 10000
Failed requests: 0
Write errors: 0
Non-2xx responses: 10000
Total transferred: 6080000 bytes
HTML transferred: 3810000 bytes
Requests per second: 12890.88 [#/sec] (mean)
Time per request: 6.206 [ms] (mean)
Time per request: 0.078 [ms] (mean, across all concurrent requests)
Transfer rate: 7653.96 [Kbytes/sec] received
Connection Times (ms)
min mean[+/-sd] median max
Connect: 0 1 0.4 1 6
Processing: 4 5 1.0 5 14
Waiting: 1 5 0.9 4 14
Total: 5 6 1.3 6 19
WARNING: The median and mean for the waiting time are not within a normal deviation
These results are probably not that reliable.
Percentage of the requests served within a certain time (ms)
50% 6
66% 6
75% 6
80% 6
90% 7
95% 7
98% 11
99% 12
100% 19 (longest request)
Apache测试:
请求 并发 吞吐率 相应时间
10000 100 12372 8.082
10000 100 12616 7.926
10000 100 12724 7.859
10000 150 11707 12.812
10000 150 11871 12.635
10000 150 11783 12.730
10000 80 12890 6.206
10000 80 12565 6.367
10000 80 12985 6.161
10000 200 11766 116.997
10000 200 12050 16.597
10000 200 11926 16.770
Nginx测试(安装方法请看:nginx安装-自己总结的 ):
因为要环境一模一样,所以把apache的index.html文件cp过来:
[root@linux-node6 ~]# cp /usr/local/httpd/htdocs/aaa/index.html /usr/local/nginx/html/index.html
cp: overwrite 鈥usr/local/nginx/html/index.html鈥 y
[root@linux-node6 ~]# ll /usr/local/nginx/html/index.html
-rwxr-xr-x 1 root root 2424 Aug 21 04:43 /usr/local/nginx/html/index.html
一样使用ab测试,因为nginx的端口改成了8080,所以:
[root@linux-node6 ~]# ab -n 10000 -c 80 http://192.168.10.106:8080/
[root@linux-node6 ~]# ab -n 10000 -c 100 http://192.168.10.106:8080/
[root@linux-node6 ~]# ab -n 10000 -c 150 http://192.168.10.106:8080/
[root@linux-node6 ~]# ab -n 10000 -c 200 http://192.168.10.106:8080/
请求 并发 吞吐率 相应时间
10000 80 20249 3.951
10000 80 20143 3.972
10000 80 19286 4.148
10000 100 19992 5.002
10000 100 20019 4.995
10000 100 19855 5.036
10000 150 16237 9.238
10000 150 15759 9.518
10000 150 15906 9.430
10000 200 15643 12.785
10000 200 16163 12.373
10000 200 15607 12.814
通过以上的方法可以看出apache和nginx的区别吧,也可以看出该服务器的吞吐量和响应时间在那个数值比较适合,那个数值相差比较大。相差大,说明到该数值已经到了服务器的性能瓶颈(数值再增加,数值相差更大)。同时我们也可以通过此方法进行性能调优,看看调优的方法是否有用。这里就不一一介绍,具体还需要自己去探索实践。