这个示例使用 vue-cli 脚手架搭建
安装echarts依赖
npm install echarts -S
或者使用国内的淘宝镜像:
- 安装
npm install -g cnpm --registry=https://registry.npm.taobao.org
使用
cnpm install echarts -S
-
创建图表
全局引入
- main.js
-
// 引入echarts
import echarts from 'echarts'

Vue.prototype.$echarts = echarts
Hello.vue
-
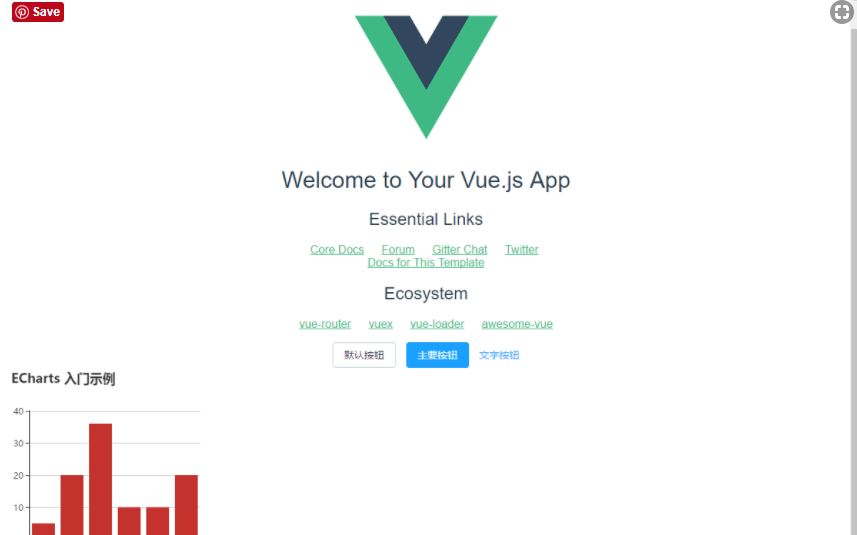
<div id="myChart" :style="{width: '300px', height: '300px'}"></div>export default { name: 'hello', data () { return { msg: 'Welcome to Your Vue.js App' } }, mounted(){ this.drawLine(); }, methods: { drawLine(){ // 基于准备好的dom,初始化echarts实例 let myChart = this.$echarts.init(document.getElementById('myChart')) // 绘制图表 myChart.setOption({ title: { text: '在Vue中使用echarts' }, tooltip: {}, xAxis: { data: ["衬衫","羊毛衫","雪纺衫","裤子","高跟鞋","袜子"] }, yAxis: {}, series: [{ name: '销量', type: 'bar', data: [5, 20, 36, 10, 10, 20] }] }); } } }
-
注意: 这里echarts初始化应在钩子函数mounted()中,这个钩子函数是在el 被新创建的 vm.$el 替换,并挂载到实例上去之后调用
按需引入
上面全局引入会将所有的echarts图表打包,导致体积过大,所以我觉得最好还是按需引入。
- Hello.vue
-
// 引入基本模板
let echarts = require('echarts/lib/echarts')
// 引入柱状图组件
require('echarts/lib/chart/bar')
// 引入提示框和title组件
require('echarts/lib/component/tooltip')
require('echarts/lib/component/title')
export default {
  name: 'hello',
  data() {
    return {
      msg: 'Welcome to Your Vue.js App'
    }
  },
  mounted() {
    this.drawLine();
  },
  methods: {
    drawLine() {
      // 基于准备好的dom,初始化echarts实例
      let myChart = echarts.init(document.getElementById('myChart'))
      // 绘制图表
      myChart.setOption({
        title: { text: 'ECharts 入门示例' },
        tooltip: {},
        xAxis: {
          data: ["衬衫", "羊毛衫", "雪纺衫", "裤子", "高跟鞋", "袜子"]
        },
        yAxis: {},
        series: [{
          name: '销量',
          type: 'bar',
          data: [5, 20, 36, 10, 10, 20]
        }]
      });
    }
  }
}
-
这里之所以使用 require 而不是 import,是因为 require 可以直接从 node_modules 中查找,而 import 必须把路径写全。
-
页面展示
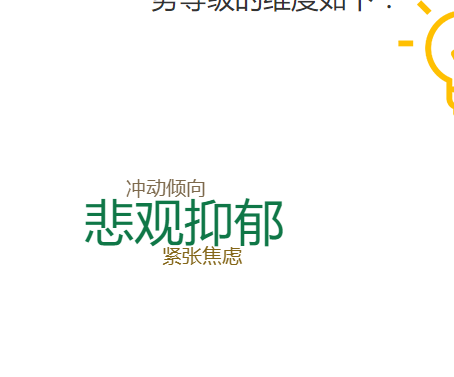
如果需要引入像字符云之类的官方包里没有的图表,可以在github上找到,如何使用具体请参考文章http://www.cnblogs.com/Smiled/p/7146550.html
字符云示例:
-
cnpm install echarts -S
在需要使用的页面引入
-
require('echarts-wordcloud');页面展示:
-
-
-