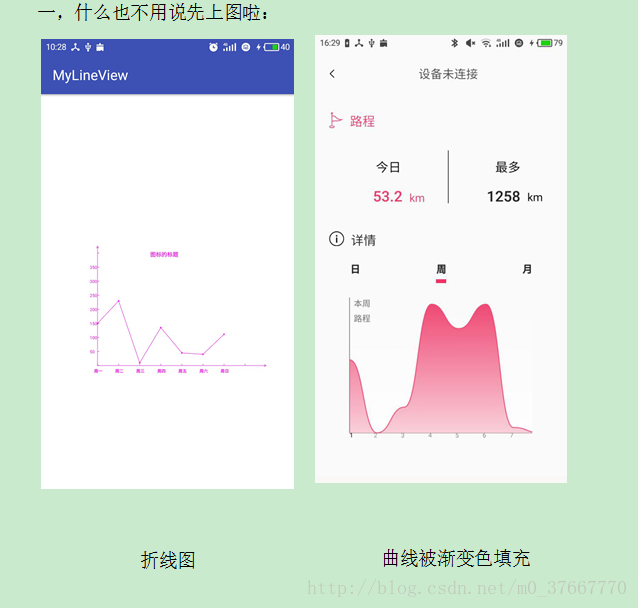
一,什么也不用说先上图啦:
二,原重点内容理 :
首先我们得知绘制折线图的思路,在android画布里面我们用画笔可以绘制点,通过点画线连接就成了各种我们需要的折线,所以我们只需要确定每个点然后连接起来就成了折线如图一。
三,分析折线图所需要的变量。
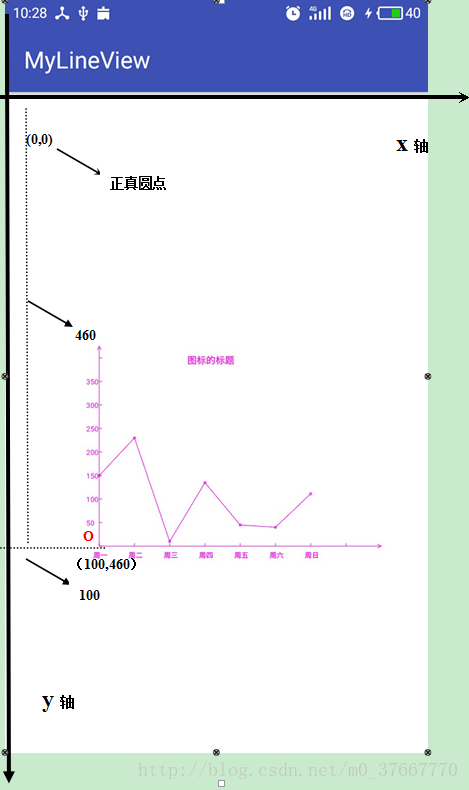
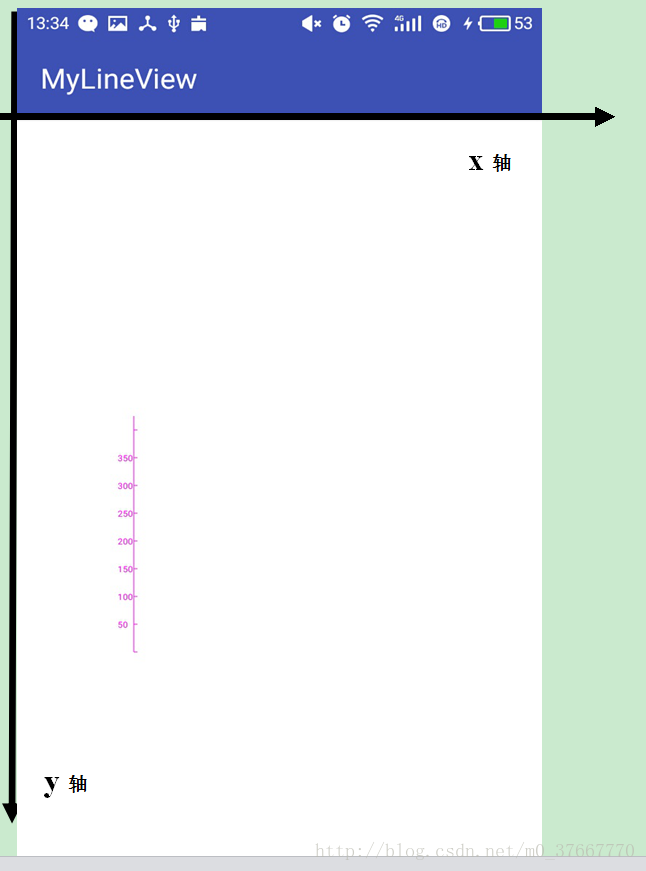
如上图所示,我们只需要确定圆点坐标O点的坐标,以及X轴和Y
轴的长度(这里指的是里面那两个x和y轴),以及X和Y轴上每段刻度的长度,那么我们就可以确定坐标系上所有刻度点的坐标,那么就可以简单的绘制出坐标系。
我们定义成员变量:
圆点(XPoint,YPoint),我们这里赋值测试数据XPoint=100,YPoint=460,设置X轴的长度为XLength=480;Ylength=340,X轴刻度的长度XScale=60,YScale=40;当然要显示的写在X轴下方和写在Y轴左边的的数字,以及折线数据分别是String[] XLable,YLable,Data;
当然这些数字后面我们可以在使用的Activity中通过方法来设置。这里测试用。
四 ,代码实现分析过程
1.首先定义一个类继承View,定义成员变量,以及构造函数设置一个方法用来初始化成员变量:代码如下:
public class BrokenLineView extends View {
    public int mXPoint;    //原点的X坐标
    public int mYPoint;     //原点的Y坐标
    public int mXScale=60;     //X的刻度长度
    public int mYScale=40;     //Y的刻度长度
    public int XLength=480;        //X轴的长度
    public int YLength=340;        //Y轴的长度
    public String[] XLabel;    //X的刻度
    public String[] YLabel;    //Y的刻度
    public String[] mData;      //数据
    public String Title;    //显示的标题
    public BrokenLineView(Context context) {
        super(context);
    }
    public BrokenLineView(Context context, AttributeSet attrs) {
        this(context, attrs, 0);
    }

    public BrokenLineView(Context context, AttributeSet attrs, int defStyleAttr) {
        super(context, attrs, defStyleAttr);
    }
    public void SetInfo(String[] XLabel, String[] YLable, String[] mData, String Title,int mx,int my) {
        this.XLabel = XLabel;
        this.YLabel = YLable;
        this.mData = mData;
        this.Title = Title;
        mXPoint=mx;
        mYPoint=my;
    }
}
2,接下来我们在onDraw里面初始化设置画笔和画布:
@Override
protected void onDraw(Canvas canvas){
    super.onDraw(canvas);//重写onDraw方法
//设置背景颜色根据你的需要,我这里背景设为白色和我的activity
布局一个颜色
    canvas.drawColor(Color.parseColor("#ffffff"));
    Paint paint= new Paint();
    paint.setStyle(Paint.Style.STROKE);
    paint.setAntiAlias(true);//去锯齿
    paint.setColor(Color.parseColor("#ff02f2"));//颜色
    Paint paint1=new Paint();
    paint1.setStyle(Paint.Style.STROKE);
    paint1.setAntiAlias(true);//去锯齿
    paint1.setColor(Color.DKGRAY);
    paint.setTextSize(12);  //设置轴文字大小
}
3,然后我们就可以在onDraw()里面继续进行绘制坐标轴了:首先设置Y轴:结果图如下:
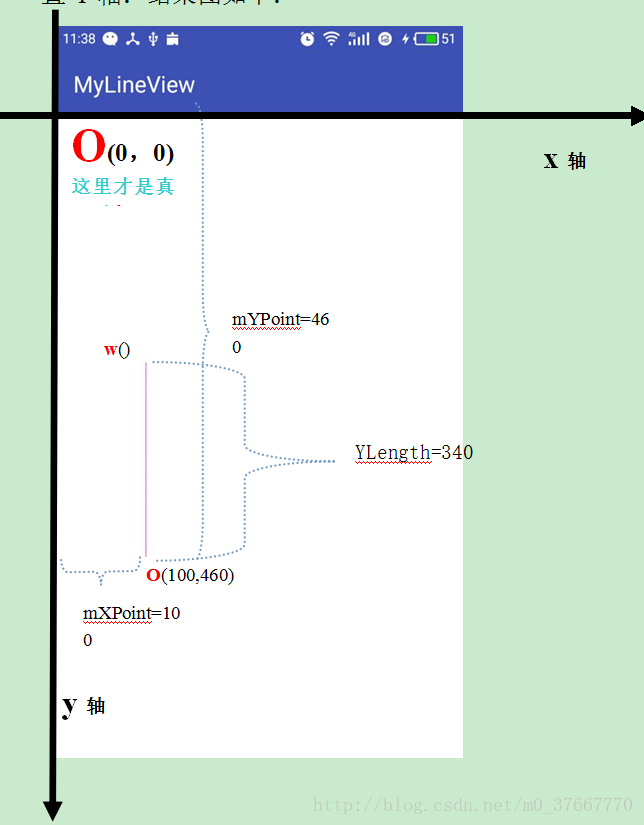
第一步:我们要画出Y这个轴线,首先我们已经知道了坐标 O具体位置(100,460),以及Y轴长度YLength=340,这时候我们就能计算出
w位置的坐标了,注意真正的原点是(0,0),w点的坐标值x=mXPoint=100,y=mYPoint-YLength;
所以W(mXPoint,mYPoint-Ylength)
那么我们就可以通过:canvas.drawLine();来画出Y轴
//设置Y轴
canvas.drawLine(mXPoint, mYPoint-YLength, mXPoint, mYPoint, paint); 或者canvas.drawLine( mXPoint, mYPoint, mXPoint, mYPoint-YLength,paint);都可以从那个点画到那个点都一样,一般我朝着正方向画。就用第一个啦。
这时候在onDraw();方法里面添加上面一句运行结果如上图。代码后面会全部贴出了以及有GitHub连接的不要着急哦。吃饭去了来了继续撸代码。
吃完饭来了继续撸代码:
第二步:我们来画出Y轴的刻度。运行结果如下图:
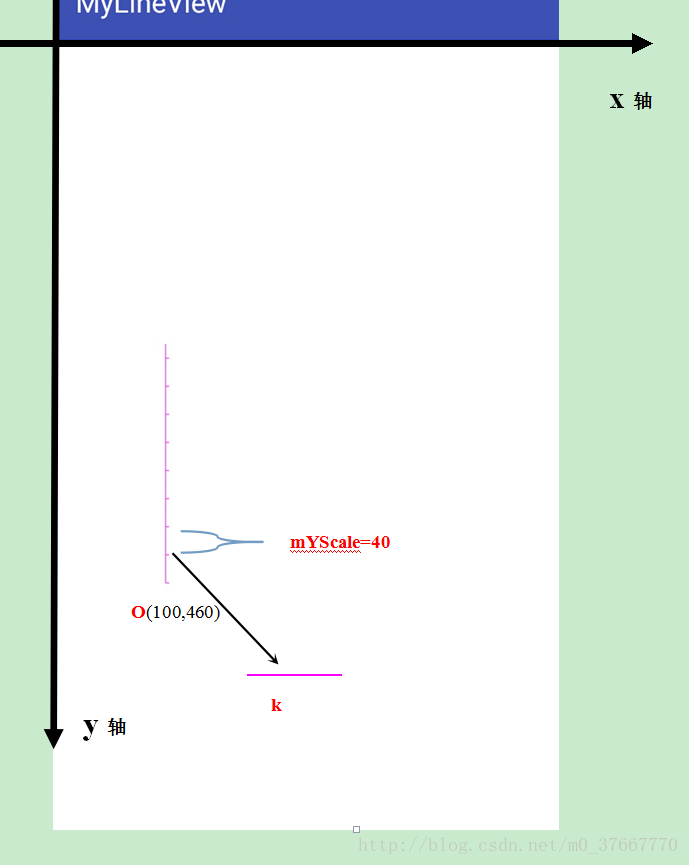
如上图所示知道O(点的坐标),那么我们可以知道每个Y轴刻度的坐标O点上面第一个刻度坐标x=mXPoint,Y=mYPoint-mYScale,我们把刻度放大如图k线条一样。刻度右边我们可以x=mXPoint+5(当然这里你可以设置需要的刻度长度),Y=mYPoint-mYScale。可以画出
我们可以通过for来画出每个刻度
//根据Y轴的长度来决定刻度个数
for(int i=0;i*mYScale<YLength ;i++) {
 canvas.drawLine(mXPoint,mYPoint-i*mYScale, mXPoint+5,
                          mYPoint-i*mYScale, paint);  //刻度
}
将这段代码添加到onDraw();里面运行之后上图所示。
第三步:我们来画出Y轴左边的字体:显示如图所示
我们已经知道了刻度的坐标。那么就不难得出字体的坐标了。因为他们的纵坐标都一样。只是横坐标要靠近左边正真的Y轴了,我们可以得到50这个字体的具体坐标了。(mXPoint-22,mYPoint+5)这里的这个减去22为了让字体在Y轴左边,+5也是调整字体位置,好在刻度的左边中间。注意了正在原点在哪里初中数学学过的哦,当然了这个间距自己可以随便调,直到自己满意为止。
我们可在上个for循环中写上代码实现刻度值的实现。
try
{
canvas.drawText(YLabel[i] , mXPoint-22, mYPoint-i*mYScale+5, paint);  //文字
}
catch(Exception e)
{
}
这里我们处理异常不然会角标越界哦!
运行结果如上图:
第四部:我们实现箭头:
如图下图所示:
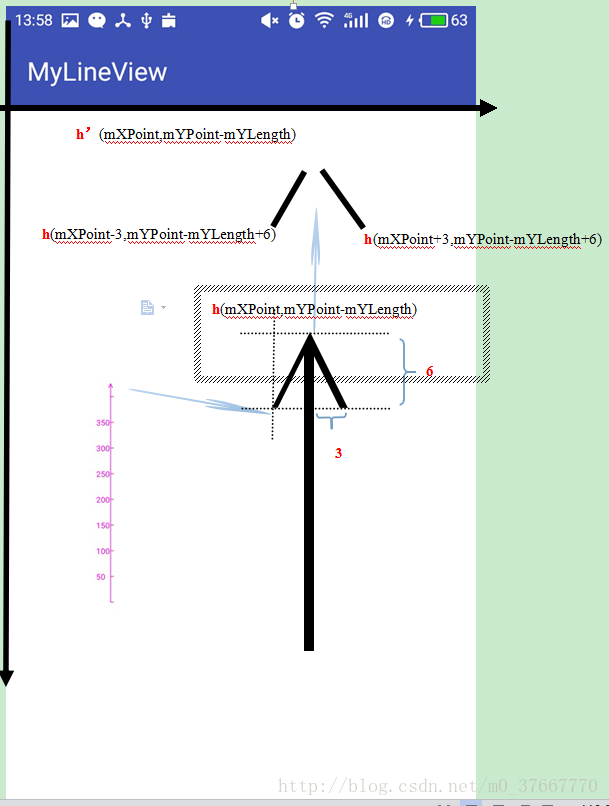
如上图所画我们可以画出箭头,希望自己动手画画,其实很容易理解的。
那么我们可以通过画两条倾斜的线段来形成箭头:代码如下
canvas.drawLine(mXPoint,mYPoint-YLength,mXPoint-3,mYPoint-YLength+6,paint);  //箭头
canvas.drawLine(mXPoint,mYPoint-YLength,mXPoint+3,mYPoint-YLength+6,paint);
同理我们可以画出X轴以及刻度以及刻度值了。只要你动手自己画了。那么很简单初中时候这些问题都能解决了。代码如下:过程就不画图了。自己试试:
//设置X轴
 canvas.drawLine(mXPoint,mYPoint,mXPoint+XLength,mYPoint,paint);   //轴线
 for(int i=0;i*mXScale<XLength;i++)
 {
     canvas.drawLine(mXPoint+i*mXScale, mYPoint, mXPoint+i*mXScale, mYPoint-5, paint);  //刻度
     try
     {
         canvas.drawText(XLabel[i] , mXPoint+i*mXScale-10, mYPoint+20, paint);  //文字
         //数据值
         if(i>0&&YCoord(mData[i-1])!=-999&&YCoord(mData[i])!=-999)  //保证有效数据
             canvas.drawLine(mXPoint+(i-1)*mXScale, YCoord(mData[i-1]), mXPoint+i*mXScale, YCoord(mData[i]), paint);
         canvas.drawCircle(mXPoint+i*mXScale,YCoord(mData[i]), 2, paint);
     }
     catch(Exception e)
     {
     }
 }
canvas.drawLine(mXPoint+XLength,mYPoint,mXPoint+XLength-6,mYPoint-3,paint);    //箭头
 canvas.drawLine(mXPoint+XLength,mYPoint,mXPoint+XLength-6,mYPoint+3,paint)
最后将值放到坐标上面:结果如图所示:

如图所示每个值要显示的横坐标都是从左到右确定的。主要是纵坐标,图上看
主要获取点的纵坐标计算:首先Y轴每个刻度实际长度为mYScale,每个刻度代表50
所以每份代表mYScale/50,这时候就可以计算出每个值代表的高度了Data[i]*mYScale/50
那么纵坐标为(mXPoint+mXSale,mYPoint-值*mYScale/50)
代码如下:
private int getYPoint(String y0)  //计算绘制时的Y坐标,无数据时返回-999
{
    int y;
    try
    {
        y=Integer.parseInt(y0);
    }
    catch(Exception e)
    {
        return -999;    //出错则返回-999
    }
    try
    {
        return mYPoint-y*mYScale/Integer.parseInt(YLabel[1]);
    }
    catch(Exception e)
    {
    }
    return y;
}
第五步:贴出整个自定义View代码:如下
package com.example.ls.mylineview;
import android.content.Context;
import android.graphics.Canvas;
import android.graphics.Color;
import android.graphics.Paint;
import android.util.AttributeSet;
import android.view.View;
/**
* Created by 路很长~ on 2017/6/21.
*/
public class BrokenLineView extends View {
public int mXPoint=10; //原点的X坐标
public int mYPoint=460; //原点的Y坐标
public int mXScale=60; //X的刻度长度
public int mYScale=40; //Y的刻度长度
public int XLength=480; //X轴的长度
public int YLength=340; //Y轴的长度
public String[] XLabel; //X的刻度
public String[] YLabel; //Y的刻度
public String[] mData; //数据
public String Title; //显示的标题
public BrokenLineView(Context context) {
super(context);
}
public BrokenLineView(Context context, AttributeSet attrs) {
this(context, attrs, 0);
}
public BrokenLineView(Context context, AttributeSet attrs, int defStyleAttr) {
    super(context, attrs, defStyleAttr);
}
public void SetInfo(String[] XLabel, String[] YLable, String[] mData, String Title) {
    this.XLabel = XLabel;
    this.YLabel = YLable;
    this.mData = mData;
    this.Title = Title;
    mXPoint=100;
    mYPoint=460;
}
@Override
protected void onDraw(Canvas canvas){
    super.onDraw(canvas);//重写onDraw方法

    canvas.drawColor(Color.parseColor("#ffffff"));//设置背景颜色
    Paint paint= new Paint();
    paint.setStyle(Paint.Style.STROKE);
    paint.setAntiAlias(true);//去锯齿
    paint.setColor(Color.parseColor("#ff02f2"));//颜色
    Paint paint1=new Paint();
    paint1.setStyle(Paint.Style.STROKE);
    paint1.setAntiAlias(true);//去锯齿
    paint1.setColor(Color.DKGRAY);
    paint.setTextSize(12);  //设置轴文字大小
    //设置Y轴
    canvas.drawLine(mXPoint, mYPoint,mXPoint, mYPoint-YLength,  paint);   //轴线
   for(int i=0;i*mYScale<YLength ;i++)
    {
        canvas.drawLine(mXPoint,mYPoint-i*mYScale, mXPoint+5, mYPoint-i*mYScale, paint);  //刻度
        try
        {
            canvas.drawText(YLabel[i] , mXPoint-22, mYPoint-i*mYScale+5, paint);  //文字
        }
        catch(Exception e)
        {
        }
    }
    canvas.drawLine(mXPoint,mYPoint-YLength,mXPoint-3,mYPoint-YLength+6,paint);  //箭头
    canvas.drawLine(mXPoint,mYPoint-YLength,mXPoint+3,mYPoint-YLength+6,paint);
   //设置X轴
    canvas.drawLine(mXPoint,mYPoint,mXPoint+XLength,mYPoint,paint);   //轴线
    for(int i=0;i*mXScale<XLength;i++)
    {
        canvas.drawLine(mXPoint+i*mXScale, mYPoint, mXPoint+i*mXScale, mYPoint-5, paint);  //刻度
        try
        {
            canvas.drawText(XLabel[i] , mXPoint+i*mXScale-10, mYPoint+20, paint);  //文字
            //数据值
            if(i>0&&getYPoint(mData[i-1])!=-999&&getYPoint(mData[i])!=-999)  //保证有效数据
                canvas.drawLine(mXPoint+(i-1)*mXScale, getYPoint(mData[i-1]), mXPoint+i*mXScale, getYPoint(mData[i]), paint);
            canvas.drawCircle(mXPoint+i*mXScale,getYPoint(mData[i]), 2, paint);
        }
        catch(Exception e)
        {
        }
    }
    canvas.drawLine(mXPoint+XLength,mYPoint,mXPoint+XLength-6,mYPoint-3,paint);    //箭头
    canvas.drawLine(mXPoint+XLength,mYPoint,mXPoint+XLength-6,mYPoint+3,paint);
    paint.setTextSize(16);
    canvas.drawText(Title, 250, 150, paint);
}
private int getYPoint(String y0)  //计算绘制时的Y坐标,无数据时返回-999
{
    int y;
    try
    {
        y=Integer.parseInt(y0);
    }
    catch(Exception e)
    {
        return -999;    //出错则返回-999
    }
    try
    {
        return mYPoint-y*mYScale/Integer.parseInt(YLabel[1]);
    }
    catch(Exception e)
    {
    }
    return y;
 }
}
第六步贴出Activity调用代码:
我想.xml就没必要了吧。还是简单来一个:
<?xml version="1.0" encoding="utf-8"?>
<LinearLayout xmlns:android="http://schemas.android.com/apk/res/android"
    xmlns:app="http://schemas.android.com/apk/res-auto"
    xmlns:tools="http://schemas.android.com/tools"
    android:layout_width="match_parent"
    android:layout_height="match_parent"
    android:gravity="center"
    android:background="#ffffff"
    tools:context="com.example.ls.mylineview.MainActivity">

   <com.example.ls.mylineview.BrokenLineView
       android:id="@+id/chartView"
       android:layout_width="300dp"
       android:layout_height="250dp" />


</LinearLayout>
7.最后在Activity里面调用:代码如下:
package com.example.ls.mylineview;

import android.support.v7.app.AppCompatActivity;
import android.os.Bundle;

public class MainActivity extends AppCompatActivity {
    private BrokenLineView broken_line;

    @Override
    protected void onCreate(Bundle savedInstanceState) {
        super.onCreate(savedInstanceState);
        setContentView(R.layout.activity_main);
        BrokenLineView brokenview= (BrokenLineView) findViewById(R.id.chartView);
        brokenview.SetInfo(
                new String[]{"周一","周二","周三","周四","周五","周六","周日"},   //X轴刻度
                new String[]{"","50","100","150","200","250","300","350"},   //Y轴刻度
                new String[]{"150","230","10","136","45","40","112","313"},  //数据
                "图标的标题"
        );
    }
}
曲线代码地址下载:https://github.com/luhenchang/MyQuxian.git
有问题:本人qq:1276998208