import pandas as pd
import numpy as np
import matplotlib.pyplot as plt
plt.style.use('ggplot')
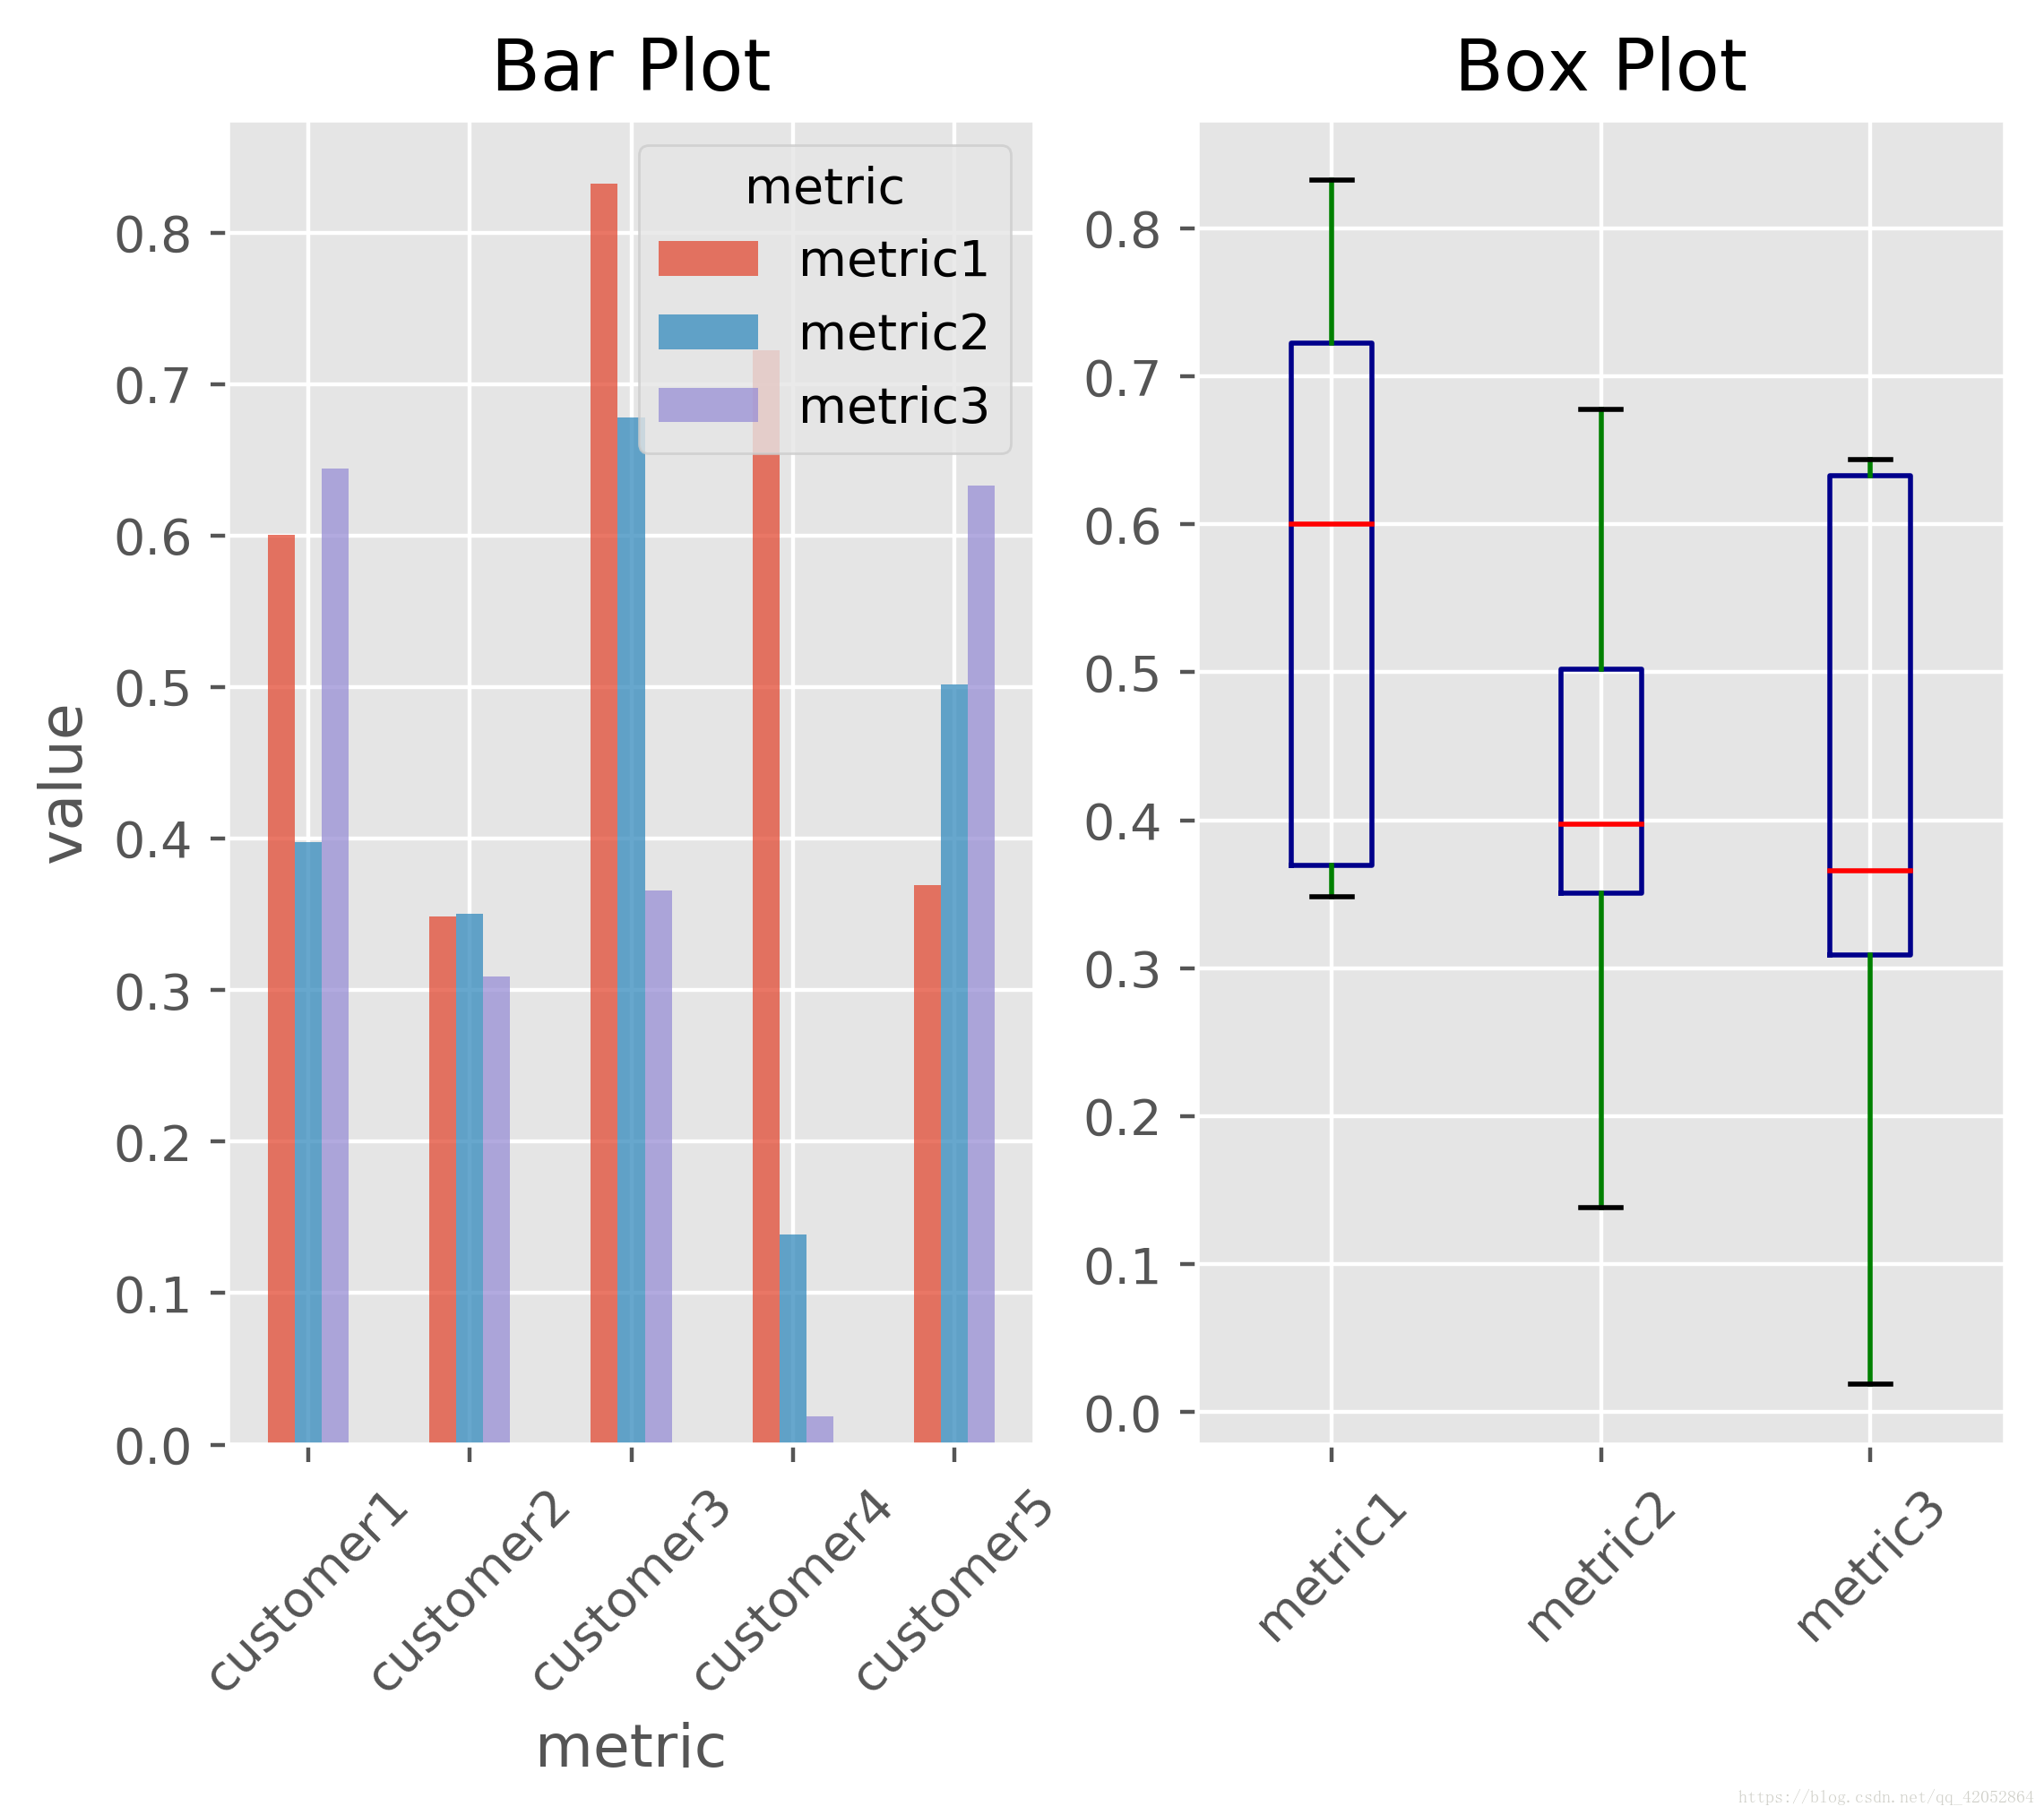
fig,axes=plt.subplots(nrows=1,ncols=2)
axes1,axes2=axes.ravel()
data_frame=pd.DataFrame(np.random.rand(5,3),index=['customer1','customer2','customer3','customer4','customer5'],columns=pd.Index(['metric1','metric2','metric3'],name='metric'))
data_frame.plot(kind='bar',ax=axes1,alpha=0.75,title='Bar Plot')
plt.setp(axes1.get_xticklabels(),rotation=45,fontsize=10)
plt.setp(axes1.get_yticklabels(),rotation=0,fontsize=10)
axes1.set_xlabel('customer')
axes1.xaxis.set_ticks_position('bottom')
axes1.set_ylabel('value')
axes1.yaxis.set_ticks_position('left')
colors=dict(boxes='DarkBlue',whiskers='Green',medians='Red',caps='Black')
data_frame.plot(kind='box',color=colors,ax=axes2,title='Box Plot')
plt.setp(axes2.get_xticklabels(),rotation=45,fontsize=10)
plt.setp(axes2.get_yticklabels(),rotation=0,fontsize=10)
axes1.set_xlabel('metric')
axes1.set_ylabel('value')
axes1.xaxis.set_ticks_position('bottom')
axes1.yaxis.set_ticks_position('left')
plt.savefig('E:\python\慕课网 python\.idea\photo\pa.png',dpi=400,bbox_inches='tight')
plt.show()Bar Box
猜你喜欢
转载自blog.csdn.net/qq_42052864/article/details/81708625
今日推荐
周排行