This document is intended to help troubleshoot IPSec ××× connectivity issues. It is divided into two parts, one for each Phase of an IPSec ×××.
Phase 1: IKE
1: To rule out ISP-related issues, try pinging the peer IP from the PA external interface. Ensure that pings are enabled on the peer's external interface.
2: If pings have been blocked per security requirements, see if the other peer is responding to the main/aggressive mode messages, or the DPDs. Check for the responses of the "Are you there?" messages from the peer in the system logs under the Monitor tab(Web UI) or under ikemgr logs(CMD).
3: Check that the IKE identity is configured correctly.
4: Check that the policy is in place to permit IKE and IPSec applications. Usually this policy is not required if there is no clean-up rule configured on the box. If a clean-up rule is configured, the policy is configured usually from the external zone to the external zone.
5: Check that proposals are correct. If incorrect, logs about the mismatch can be found under the system logs, or by using the following CLI command:
> less mp-log ikemgr.log
6:Check that preshared key is correct. If incorrect, logs about the mismatch can be found under the system logs, or by using the following CLI command:
> less mp-log ikemgr.log
7: Take packet captures to analyze the traffic. Use filters to narrow the scope of the captured traffic.
Useful CLI commands:
> show *** ike-sa gateway <name>
> test *** ike-sa gateway <name>
> debug ike stat
Advanced CLI commands:
For detailed logging, turn on the logging level to debug:
> debug ike global on debug
> less mp-log ikemgr.log //to view detail debug information from mp-log
8: To view the main/aggressive and quick mode negotiations, it is possible to turn on pcaps for capturing these negotiations. Messages 5 and 6 onwards in the main mode and all the packets in the quick mode have their data payload encrypted:
> debug ike pcap on
> view-pcap no-dns-lookup yes no-port-lookup yes debug-pcap ikemgr.pcap
Turn off debugs
> debug ike pcap off
9: Configuring packet filter and captures restricts pcaps only to the one worked on, debug IKE pcap on shows pcaps for all *** traffic.
10: To check if NAT-T is enabled, packets will be on port 4500 instead of 500 from the 5th and 6th messages of main mode.
11: Check if vendor id of the peer is supported on the Palo Alto Networks device and vice-versa.
Phase 2: IPSec
1: Check if the firewalls are negotiating the tunnels, and ensure that 2 unidirectional SPIs exist:
> show *** ipsec-sa
> show *** ipsec-sa tunnel <tunnel.name>
2: Check if proposals are correct. If incorrect, logs about the mismatch can be found under the system logs under the monitor tab, or by using the following command:
>less mp-log ikemgr.log
3: Check if pfs is enabled on both ends. If incorrect, logs about the mismatch can be found under the system logs under the monitor tab, or by using the command:
>less mp-log ikemgr.log
4: Check the proxy-id configuration. This is usually not required when the tunnel is between two Palo Alto Networks firewalls, but when the peer is from another vendor, IDs usually need to be configured.A mismatch would be indicated under the system logs, or by using the command:
> less mp-log ikemgr.log
Useful CLI commands:
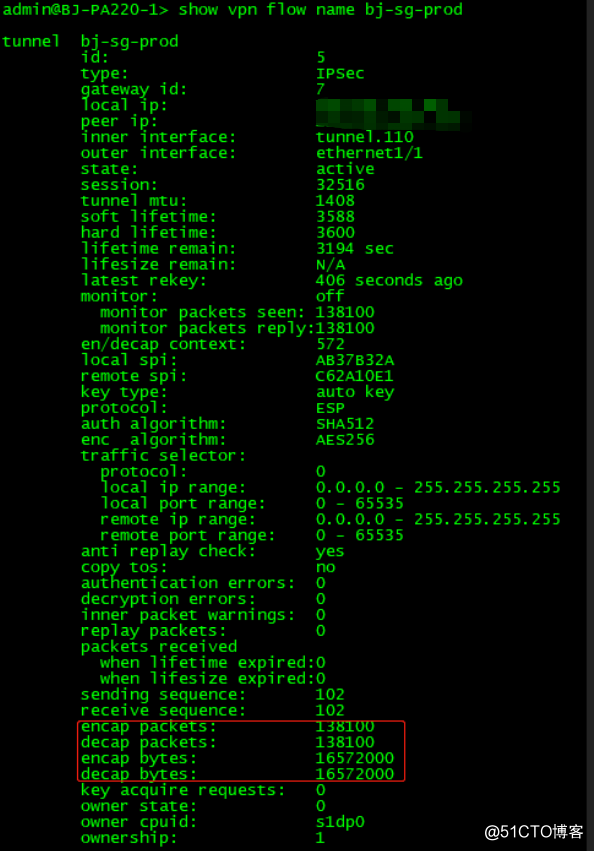
> show *** flow name <tunnel.id/tunnel.name>
> show *** flow name <tunnel.id/tunnel.name> | match bytes
5: Check if encapsulation and decapsulation bytes are increasing. If the firewall is passing traffic, then both values should be increasing.
> show *** flow name <tunnel.id/tunnel.name> | match bytes

If encapsulation bytes are increasing and decapsulation is constant, then the firewall is sending but not receiving packets.
6: Check to see if a policy is dropping the traffic, or if a port translating device in front of PAN that might be dropping the ESP packets.
> show *** flow name <tunnel.id/tunnel.name> | match bytes
If decapsulation bytes are increasing and encapsulation is constant, then the firewall is receiving but not transmitting packets.
Check to see if a policy is dropping the traffic:
> test routing fib-lookup virtual-router default ip <destination IP>
> test *** ipsec-sa tunnel <tunnel name>Advanced CLI commands:
Advanced CLI commands:
> debug ike global on debug
> less mp-log ikemgr.log
> debug ike pcap on
> view-pcap no-dns-lookup yes no-port-lookup yes debug-pcap ikemgr.pcap
> debug ike pcap off
7: If tunnels are up but traffic is not passing through the tunnel:
Check security policy and routing.
Check for any devices upstream that perform port-and-address-translations. Because ESP is a layer 3 protocol, ESP packets do not have port numbers. When such devices receive ESP packets, there is a high possibility they may silently drop them, because they do not see the port numbers to translate.
Apply debug packet filters, captures or logs, if necessary, to isolate the issue where the traffic is getting dropped.
summary:
To view the details on the active IKE phase 1 SAs:
show *** ike-sa gateway <gateway name>
Example:

To view the details on the active IKE phase 2 SAs:
show *** ipsec-sa tunnel <tunnel name>
Example:

The following commands will tear down the *** tunnel:
> clear *** ike-sa gateway <name>
> clear *** ipsec-sa tunnel <name>
The following commands will bring up the *** tunnel:
> test *** ike-sa gateway <name>
> test *** ipsec-sa tunnel <name>