1. 安装
1.1 获取安装包
到istio的release地址下载安装包,我目前使用1.0.0版:
wget https://github.com/istio/istio/releases/download/1.0.0/istio-1.0.0-linux.tar.gz 解压:
tar -zxvf istio-1.0.0-linux.tar.gz1.2 安装istioctl
如果手动注入sidecar的话需要使用这个命令,自动注入的话不装这个也行:
sudo cp istio-1.0.0/bin/istioctl /usr/local/bin/1.3 部署istio
1.3.1 安装istio的CRD
kubectl apply -f istio-1.0.0/install/kubernetes/helm/istio/templates/crds.yaml1.3.2 安装istio核心组件
核心组件的部署,官方给出了四种方式,我选择了“without mutual TLS authentication between sidecars”的方式:
kubectl apply -f istio-1.0.0/install/kubernetes/istio-demo.yaml注意:
启动文件默认配置的通过外部LoadBalancer访问istio-ingressgateway,如果没有外部LoadBalancer,需要修改启动文件使用NodePort访问istio-ingressgateway:
sed -i 's/LoadBalancer/NodePort/g' istio-1.0.0/install/kubernetes/istio-demo.yamlgcr.io和quay.io相关的镜像下载不了的话可以替换为我做好的墙内的镜像:
- daocloud.io/liukuan73/proxy_init:1.0.0
- daocloud.io/liukuan73/galley:1.0.0
- daocloud.io/liukuan73/mixer:1.0.0
- daocloud.io/liukuan73/proxyv2:1.0.0
- daocloud.io/liukuan73/pilot:1.0.0
- daocloud.io/liukuan73/citadel:1.0.0
- daocloud.io/liukuan73/servicegraph:1.0.0
- daocloud.io/liukuan73/sidecar_injector:1.0.0
- daocloud.io/liukuan73/istio-grafana:1.0.0
1.3.3 验证安装是否成功
查看是否所有服务和pod都正常:
- kubectl get svc -n istio-system:
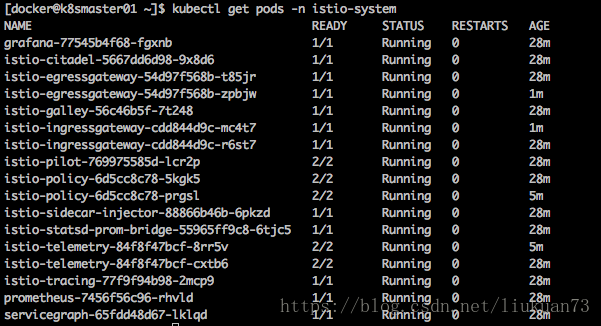
- kubectl get pods -n istio-system

2. 示例应用部署
2.1 sidecar自动注入配置
Istio装好后,如果想sidecar在应用启动时自动注入到pod中,还需要配置如下4步:
- 如上安装istio-sidecar-injector
安装了istio-sidecar-injector后,kubectl create起应用的时候sidecar容器会直接自动注入到pod中,而不用手动注入。 启用mutating webhook admission controller(k8s 1.9以上支持)
在kube-apiserver的启动参数的admission controller中按正确顺序加入如下两个controller:- MutatingAdmissionWebhook
- ValidatingAdmissionWebhook
例如:
--admission-control=Initializers,NamespaceLifecycle,LimitRanger,ServiceAccount,DefaultStorageClass,MutatingAdmissionWebhook,ValidatingAdmissionWebhook,ResourceQuota启用admissionregistration api
查看admissionregistration api是否已启用:kubectl api-versions | grep admissionregistration admissionregistration.k8s.io/v1alpha1 admissionregistration.k8s.io/v1beta1为需要自动注入sidecar的namespace打label。
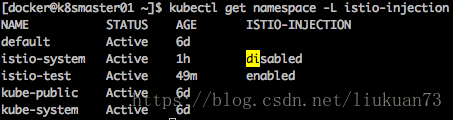
istio-sidecar-injector会为打了istio-injection=enabledlabel的namespace中的pod自动注入sidecar:kubectl label namespace istio-test istio-injection=enabled kubectl get namespace -L istio-injection
2.2 启动示例应用
以上都配置好后,就可以参照官方例子启动samples下的bookinfo示例应用(自动注入sidecar方式):
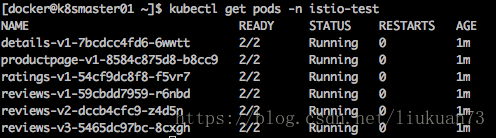
kubectl apply -n istio-test -f istio-1.0.0/samples/bookinfo/platform/kube/bookinfo.yaml可以看到每个pod中的容器都是2个,自动注入了一个sidecar容器:
注意: 应用的http流量必须使用HTTP/1.1或HTTP/2.0协议,HTTP/1.0协议不支持。
2.3 Istio Gateway创建
Istio Gateway用来实现bookinfo应用从k8s集群外部可访问。为bookinfo应用创建一个gateway和virtualservice对象:
kubectl apply -n istio-test -f istio-1.0.0/samples/bookinfo/networking/bookinfo-gateway.yaml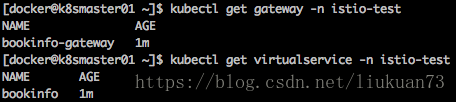
2.4 应用默认rules
kubectl apply -n istio-test -f istio-1.0.0/samples/bookinfo/networking/destination-rule-all.yaml3. 实验
3.1 智能路由
这个实验演示istio对网络流量的管理功能。
以刚才部署的bookinfo为实验对象,其架构如下图所示:
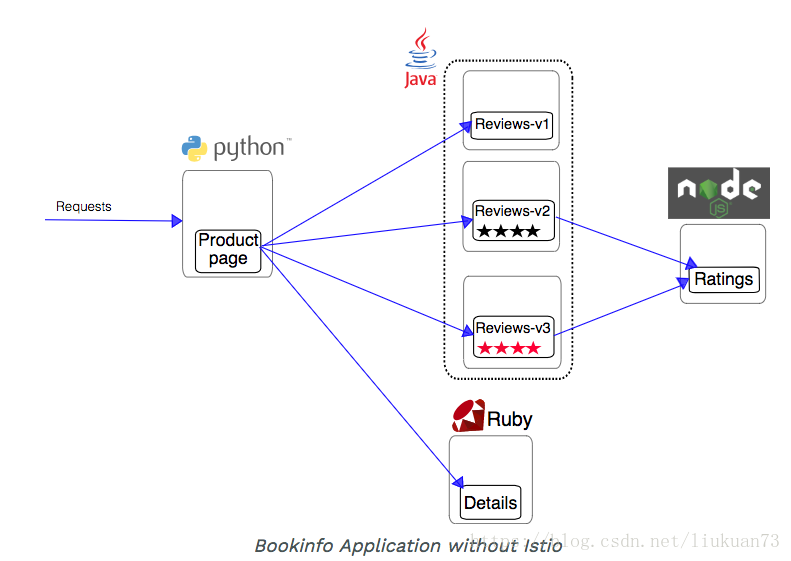
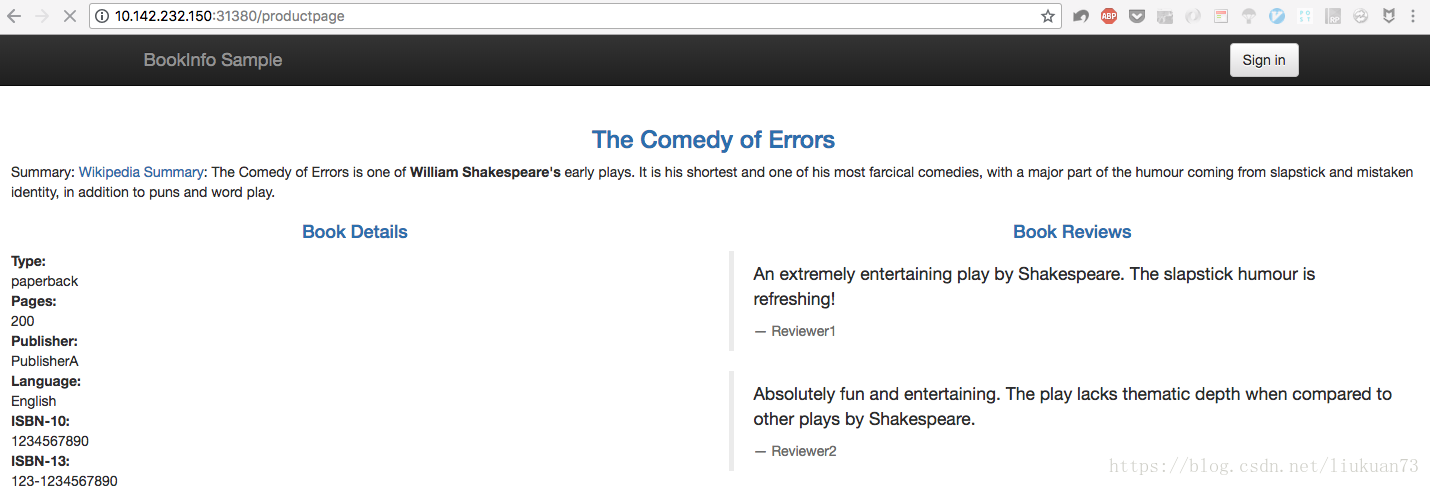
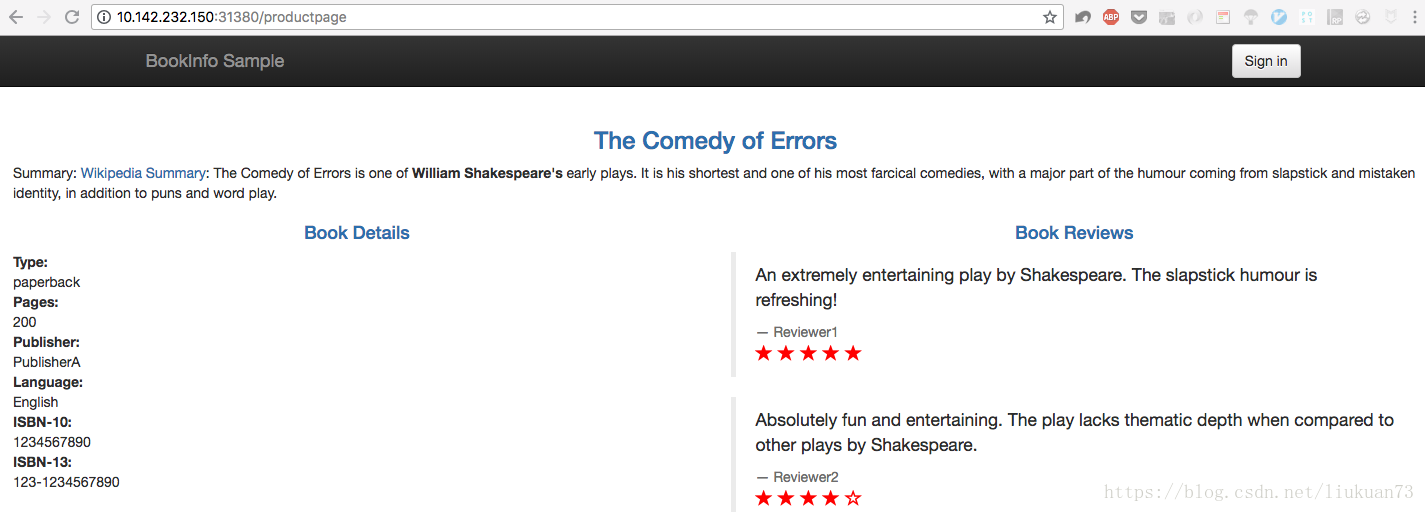
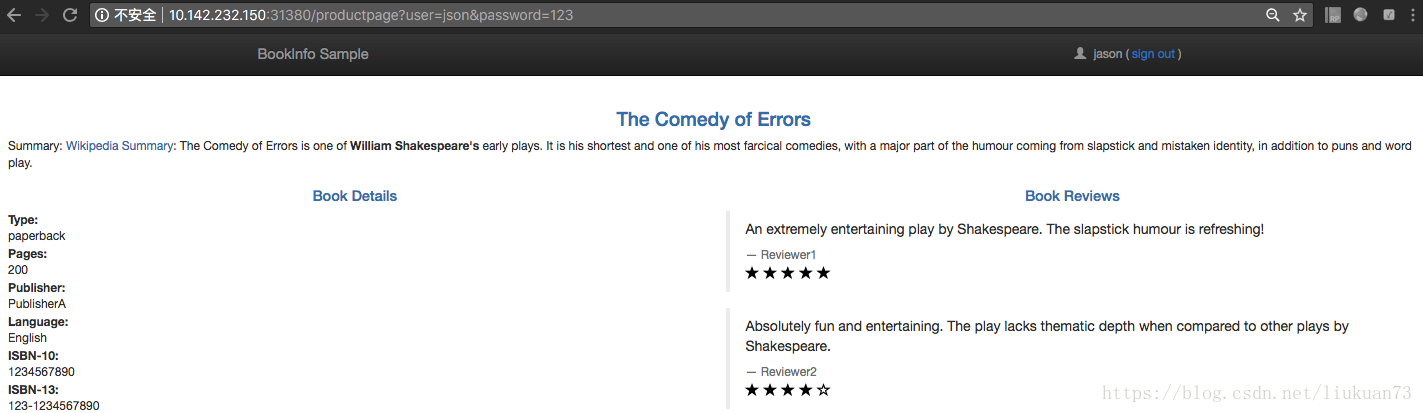
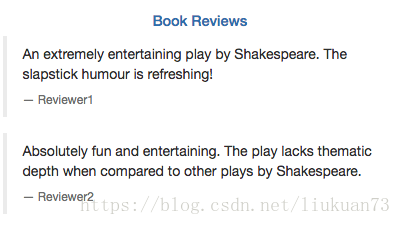
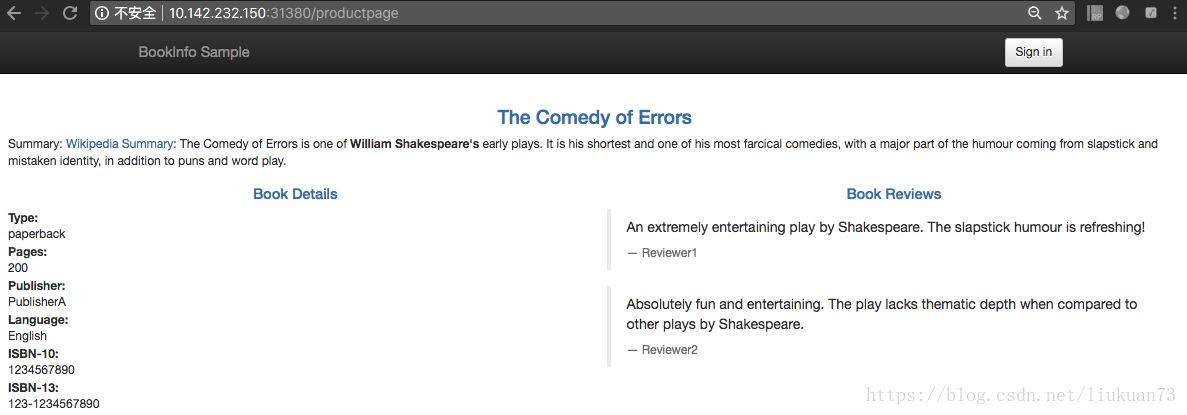
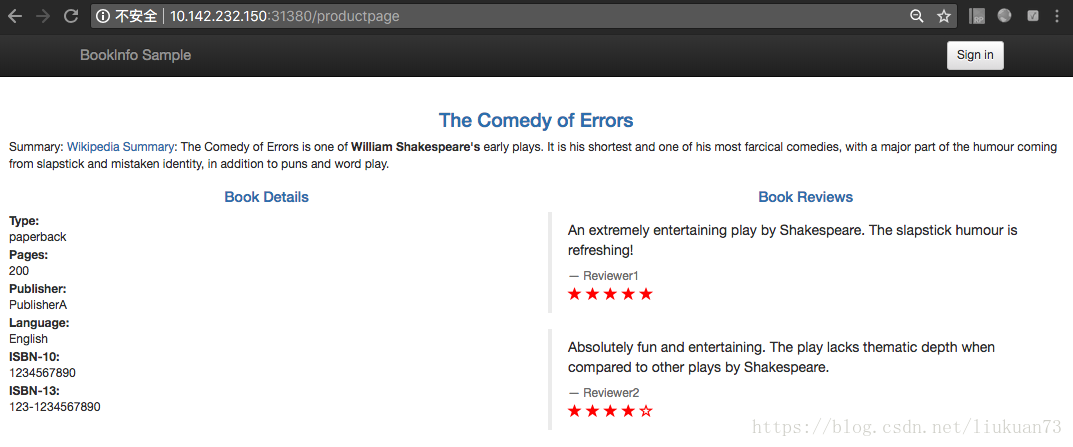
首先打开的Productage页面,由于Productpage的后端有三个不同版本的Reviews实例,默认情况下流量会随机路由到其中一个后端上。可以看到每次刷新,页面中Book Reviews里会随机出现没星、黑星和红星三种情况:

3.1.1 请求路由实验
<1>设定所有流量都导到v1版本后端
下面创建一个virtualservice使得所有流量都导向v1版本(没星)的实例:
kubectl apply -n istio-test -f istio-1.0.0/samples/bookinfo/networking/virtual-service-all-v1.yamlvirtual-service-all-v1.yaml中Reviews相关的路由规则如下所示:
apiVersion: networking.istio.io/v1alpha3
kind: VirtualService
metadata:
  name: reviews
spec:
  hosts:
  - reviews
  http:
  - route:
    - destination:
        host: reviews
        subset: v1
可以看到只有到v1的路由。此时再刷新Productpage的页面,始终都是无星版。
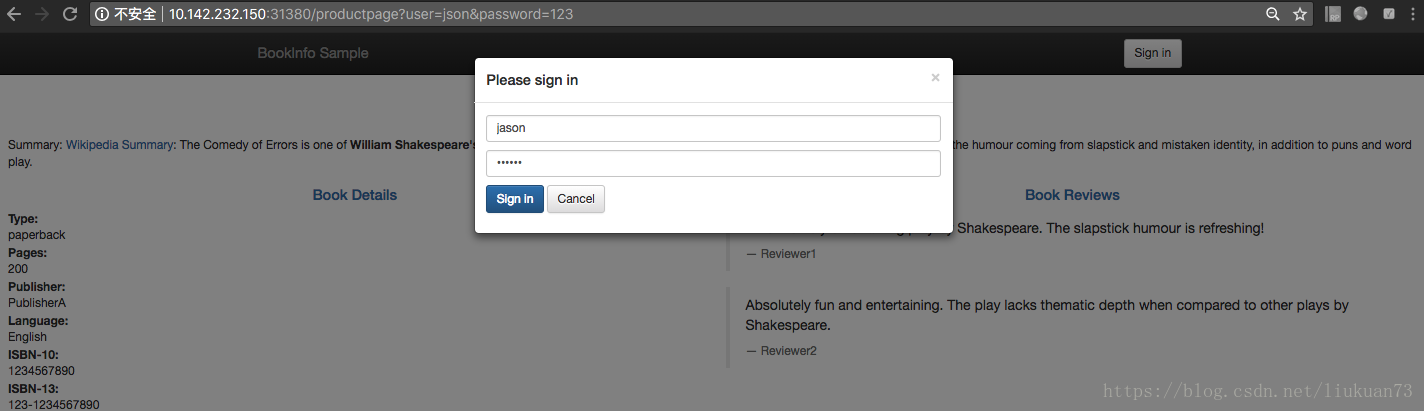
<2>设定jason用户的流量导到v2版本后端
kubectl apply -n istio-test -f istio-1.0.0/samples/bookinfo/networking/virtual-service-reviews-test-v2.yamlvirtual-service-reviews-test-v2.yaml内容如下所示:
apiVersion: networking.istio.io/v1alpha3
kind: VirtualService
metadata:
  name: reviews
spec:
  hosts:
    - reviews
  http:
  - match:
    - headers:
        end-user:
          exact: jason
    route:
    - destination:
        host: reviews
        subset: v2
  - route:
    - destination:
        host: reviews
        subset: v1
这时候再打开网页,用jason用户登录(密码随意),每次刷新页面,都是黑星版。
3.1.2 故障注入
初始化应用版本路由
如果没有做过3.1.1的请求路由实验,首先执行上面实验中的两步,初始化应用版本路由:
kubectl apply -n istio-test -f istio-1.0.0/samples/bookinfo/networking/virtual-service-all-v1.yaml
kubectl apply -n istio-test -f istio-1.0.0/samples/bookinfo/networking/virtual-service-reviews-test-v2.yaml
3.1.2.1 注入HTTP延迟实验
<1>注入HTTP延迟故障
为jason用户在reviews:v2和ratings两个微服务的访问路径之间注入一个7s延迟的人工“bug”,来测试bookinfo应用的弹性:
kubectl apply -n istio-test -f istio-1.0.0/samples/bookinfo/networking/virtual-service-ratings-test-delay.yaml查看延迟是否注入成功:
$ kubectl get virtualservice ratings -n istio-test -o yaml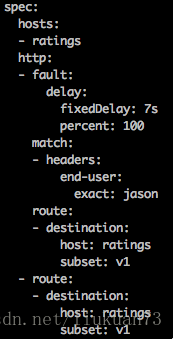
<2>测试
reviews:v2微服务在连接ratings的代码里硬编码了一个10s的连接超时机制,所以尽管引入了一个7s的延迟bug,两个服务之前的端到端流程理论上依然应该是正常的。
以jason用户登录/productpage,我们原本以为bookinfo的页面会在7s后正常加载,但是实际上Reviews区域有报错:
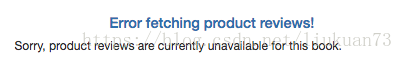
这样,通过注入延迟我们发现了一个bug。
<3>怎么回事?
虽然我们引入的7s的延迟在reviews:v2和ratings之间10s的超时机制允许范围内,但是productpage和reviews:v2两个服务的超时时间仅有6s(单次3s加一次重试机制),这导致了最终productpage报错。
以上是企业内部不同微服务独立开发时经常会遇到的一个bug。istio的故障注入机制可以使你在不影响终端用户的情况下发现此类异常。
3.1.2.2 注入HTTP Abort实验
<1>注入HTTP Abort故障
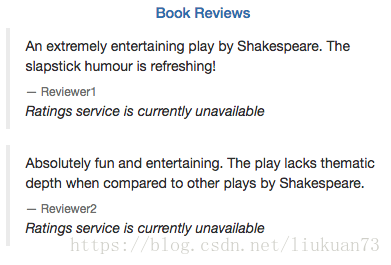
为jason用户注入一个HTTP Abor故障规则:
kubectl apply -n istio-test -f istio-1.0.0/samples/bookinfo/networking/virtual-service-ratings-test-abort.yaml查看延迟是否注入成功:
kubectl get virtualservice ratings -n istio-test -o yaml
<2>测试
以jason用户名登录, 看到页面显示:“Ratings service is currently unavailable”:
登出jason,页面显示恢复正常:
3.1.3 流量切换实验
基于权重的路由
这个实例将展示如何将逐渐地将流量从微服务的一个版本切换到另一个版本。
在istio中可以设置一系列的规则将流量按百分比从在服务间进行路由。下面这个例子首先各发50%的流量到reviews:v1和reviews:v3,然后通过设置将流量全部发到reviews:v3。
<1>首先设置将流量全部发送到各微服务的v1版本:
kubectl apply -n istio-test -f istio-1.0.0/samples/bookinfo/networking/virtual-service-all-v1.yaml打开/product页面,由于所有流量都发送到v1版本,所以,页面一直展示无星版:
<2>接下来将流量各导50%到reviews:v1和reviews:v3:
kubectl apply -n istio-test -f istio-1.0.0/samples/bookinfo/networking/virtual-service-reviews-50-v3.yaml验证规则有更新:
kubectl get virtualservice reviews -n istio-test -o yaml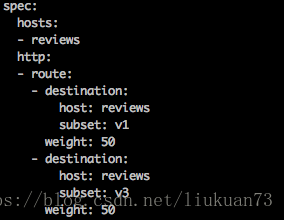
此时不断刷新页面,会在无星版(v1)和红星版(v3)中等概率切换。
<3>最后将流量全部导到reviews:v3
kubectl apply -n istio-test -f istio-1.0.0/samples/bookinfo/networking/virtual-service-reviews-v3.yaml验证规则有更新:
kubectl get virtualservice reviews -n istio-test -o yaml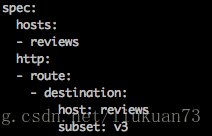
此时打开页面,不断刷新,始终是红星版(v3):
<4>原理
这个实验使用Istio的加权路由功能将流量从旧版本的 reviews 服务逐渐切换到新版本。
注意,这和使用容器编排平台的部署功能来进行版本迁移完全不同,后者使用了实例扩缩来对流量进行切换。
使用Istio,两个版本的 reviews 服务可以独立地进行扩容和缩容,并不会影响这两个版本服务之间的流量分发。
如果想了解自动伸缩的版本路由,请查看这篇博客使用istio进行金丝雀部署。
3.2 深度监测
此部分将演示如何通过mixer和sidecar获取统一的监控指标、日志和不同服务间的跟踪信息。这些信息无需开发人员对应用做任何修改,一切都是istio来实现。
3.2.1 指标收集实验
这个实验将演示如何配置istio使mesh自动收集服务的监控指标。
<1>创建配置
创建一个可以使istio自动产生和收集检测指标和日志流的yaml文件new_telemetry.yaml:
# Configuration for metric instances
apiVersion: "config.istio.io/v1alpha2"
kind: metric
metadata:
  name: doublerequestcount
  namespace: istio-system
spec:
  value: "2" # count each request twice
  dimensions:
    reporter: conditional((context.reporter.kind | "inbound") == "outbound", "client", "server")
    source: source.workload.name | "unknown"
    destination: destination.workload.name | "unknown"
    message: '"twice the fun!"'
  monitored_resource_type: '"UNSPECIFIED"'
---
# Configuration for a Prometheus handler
apiVersion: "config.istio.io/v1alpha2"
kind: prometheus
metadata:
  name: doublehandler
  namespace: istio-system
spec:
  metrics:
  - name: double_request_count # Prometheus metric name
    instance_name: doublerequestcount.metric.istio-system # Mixer instance name (fully-qualified)
    kind: COUNTER
    label_names:
    - reporter
    - source
    - destination
    - message
---
# Rule to send metric instances to a Prometheus handler
apiVersion: "config.istio.io/v1alpha2"
kind: rule
metadata:
  name: doubleprom
  namespace: istio-system
spec:
  actions:
  - handler: doublehandler.prometheus
    instances:
    - doublerequestcount.metric
---
# Configuration for logentry instances
apiVersion: "config.istio.io/v1alpha2"
kind: logentry
metadata:
  name: newlog
  namespace: istio-system
spec:
  severity: '"warning"'
  timestamp: request.time
  variables:
    source: source.labels["app"] | source.workload.name | "unknown"
    user: source.user | "unknown"
    destination: destination.labels["app"] | destination.workload.name | "unknown"
    responseCode: response.code | 0
    responseSize: response.size | 0
    latency: response.duration | "0ms"
  monitored_resource_type: '"UNSPECIFIED"'
---
# Configuration for a stdio handler
apiVersion: "config.istio.io/v1alpha2"
kind: stdio
metadata:
  name: newhandler
  namespace: istio-system
spec:
 severity_levels:
   warning: 1 # Params.Level.WARNING
 outputAsJson: true
---
# Rule to send logentry instances to a stdio handler
apiVersion: "config.istio.io/v1alpha2"
kind: rule
metadata:
  name: newlogstdio
  namespace: istio-system
spec:
  match: "true" # match for all requests
  actions:
   - handler: newhandler.stdio
     instances:
     - newlog.logentry
---
生成配置:
kubectl apply -f new_telemetry.yaml<2>向bookinfo应用发送流量:
curl 10.142.232.150:31380/productpage<3>验证指标数据成功产生和收集:
将Prometheus改成用nodePort暴露给外部访问:
kubectl edit svc prometheus -n istio-system

  ports:
  - name: http-prometheus
    port: 9090
    protocol: TCP
    targetPort: 9090
    nodePort: 30090
  selector:
    app: prometheus
  sessionAffinity: None
  type: NodePort
打开Prometheus的console tab,查看数据:
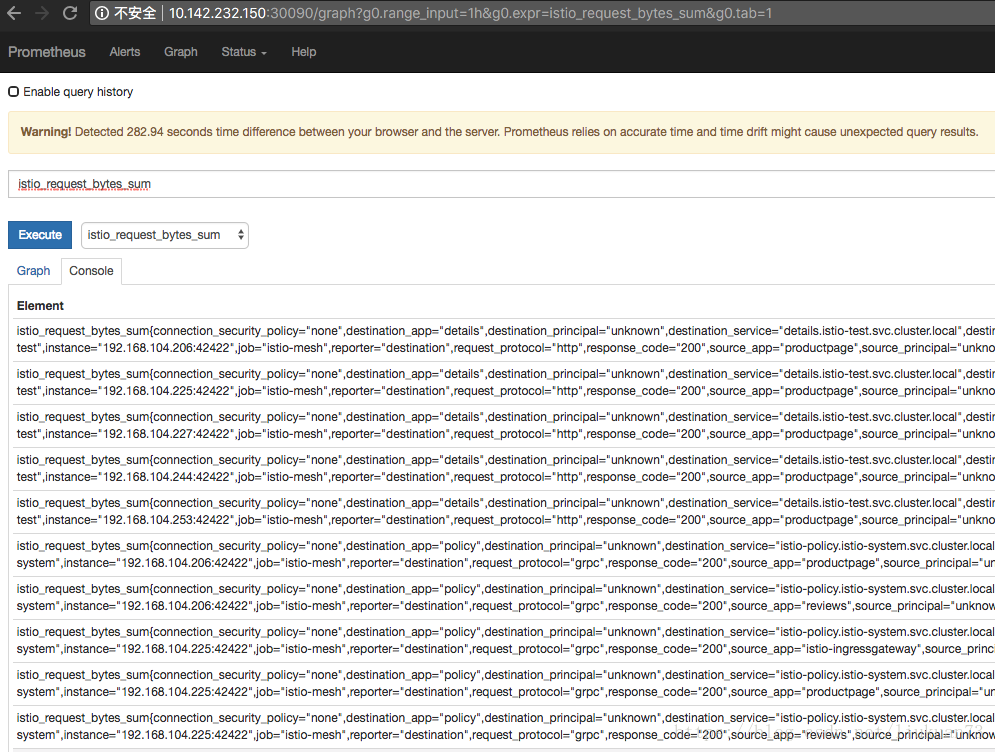
更多指标请参看:Querying Istio Metrics,还可以结合grafana进行可视化展示
查看请求过程中生成的日志流:
kubectl -n istio-system logs $(kubectl -n istio-system get pods -l istio-mixer-type=telemetry -o jsonpath='{.items[0].metadata.name}') -c mixer | grep \"instance\":\"newlog.logentry.istio-system\"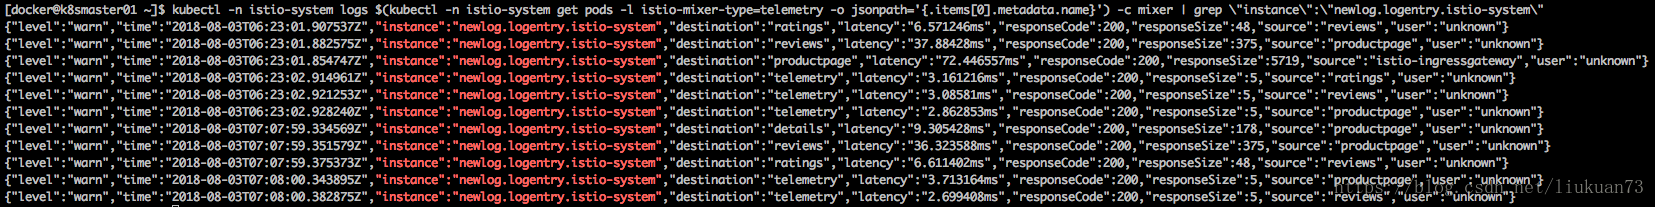
3.2.2 指标查询实验
还是使用上面的Prometheus做一些查询。打开Prometheus,在Graph页面的Expression输入框中输入查询语句进行查询。
对productpage服务的所有请求总数:
istio_requests_total{destination_service="productpage.istio-test.svc.cluster.local"}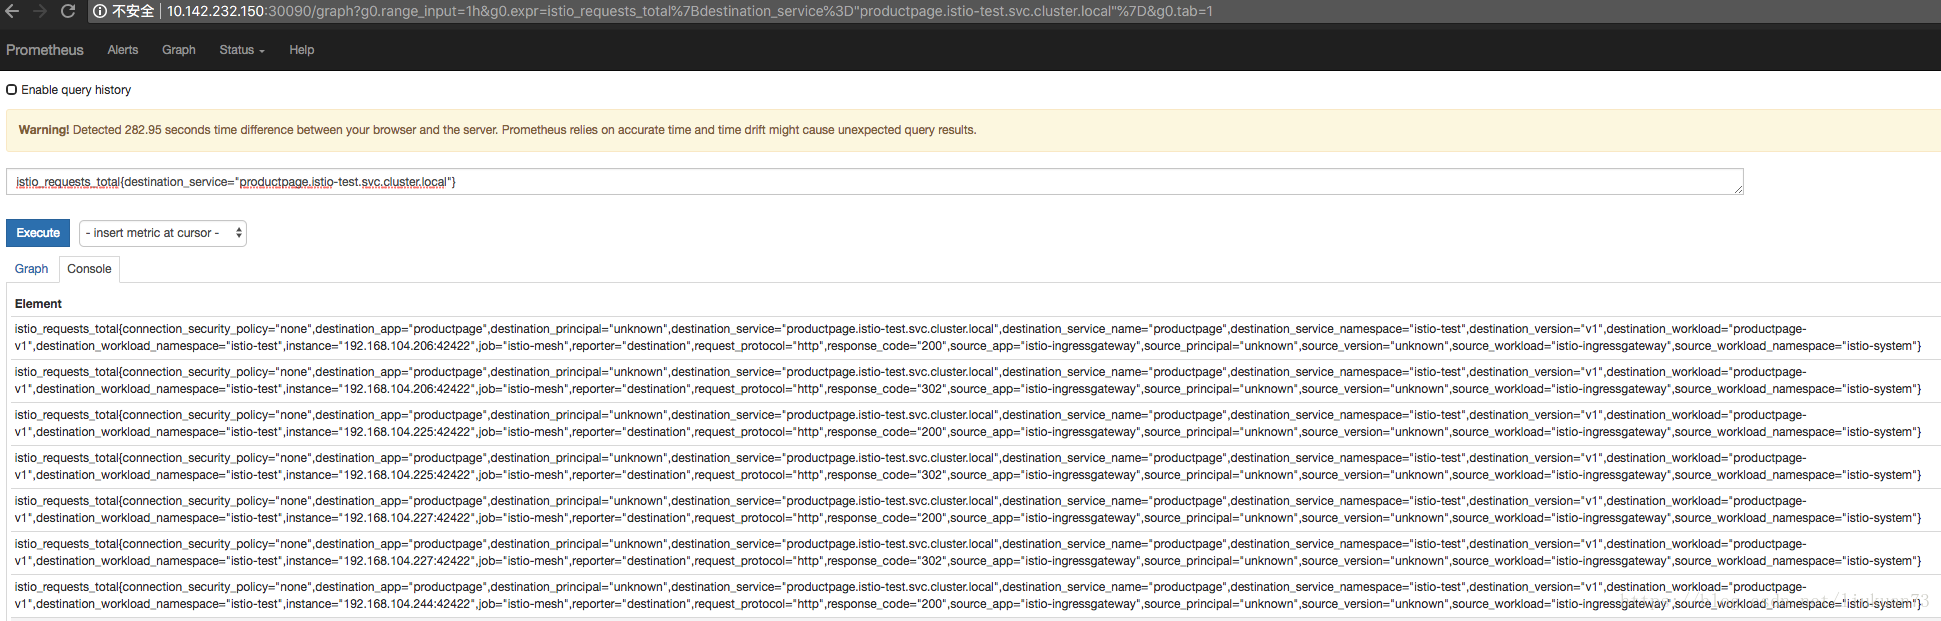
对 reviews 服务的 v3版本的所有请求总数:
istio_requests_total{destination_service="reviews.istio-test.svc.cluster.local", destination_version="v3"}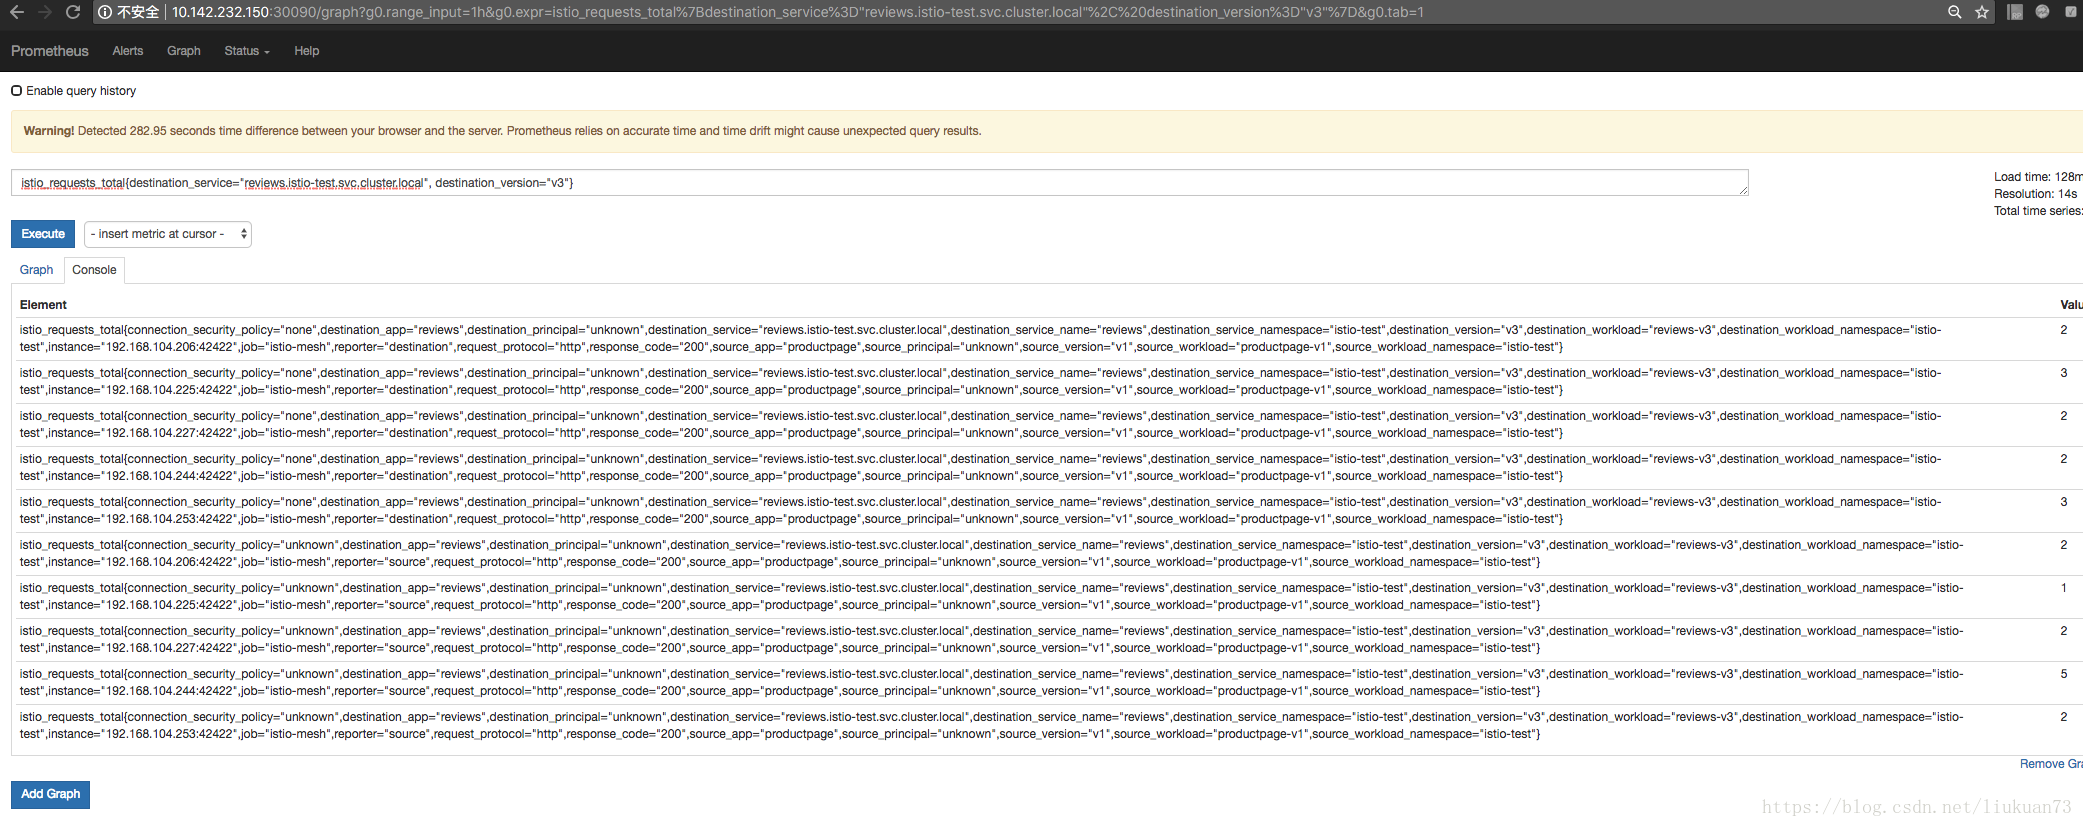
过去 5 分钟对所有 productpage 服务的请求比例:
rate(istio_requests_total{destination_service=~"productpage.*", response_code="200"}[5m])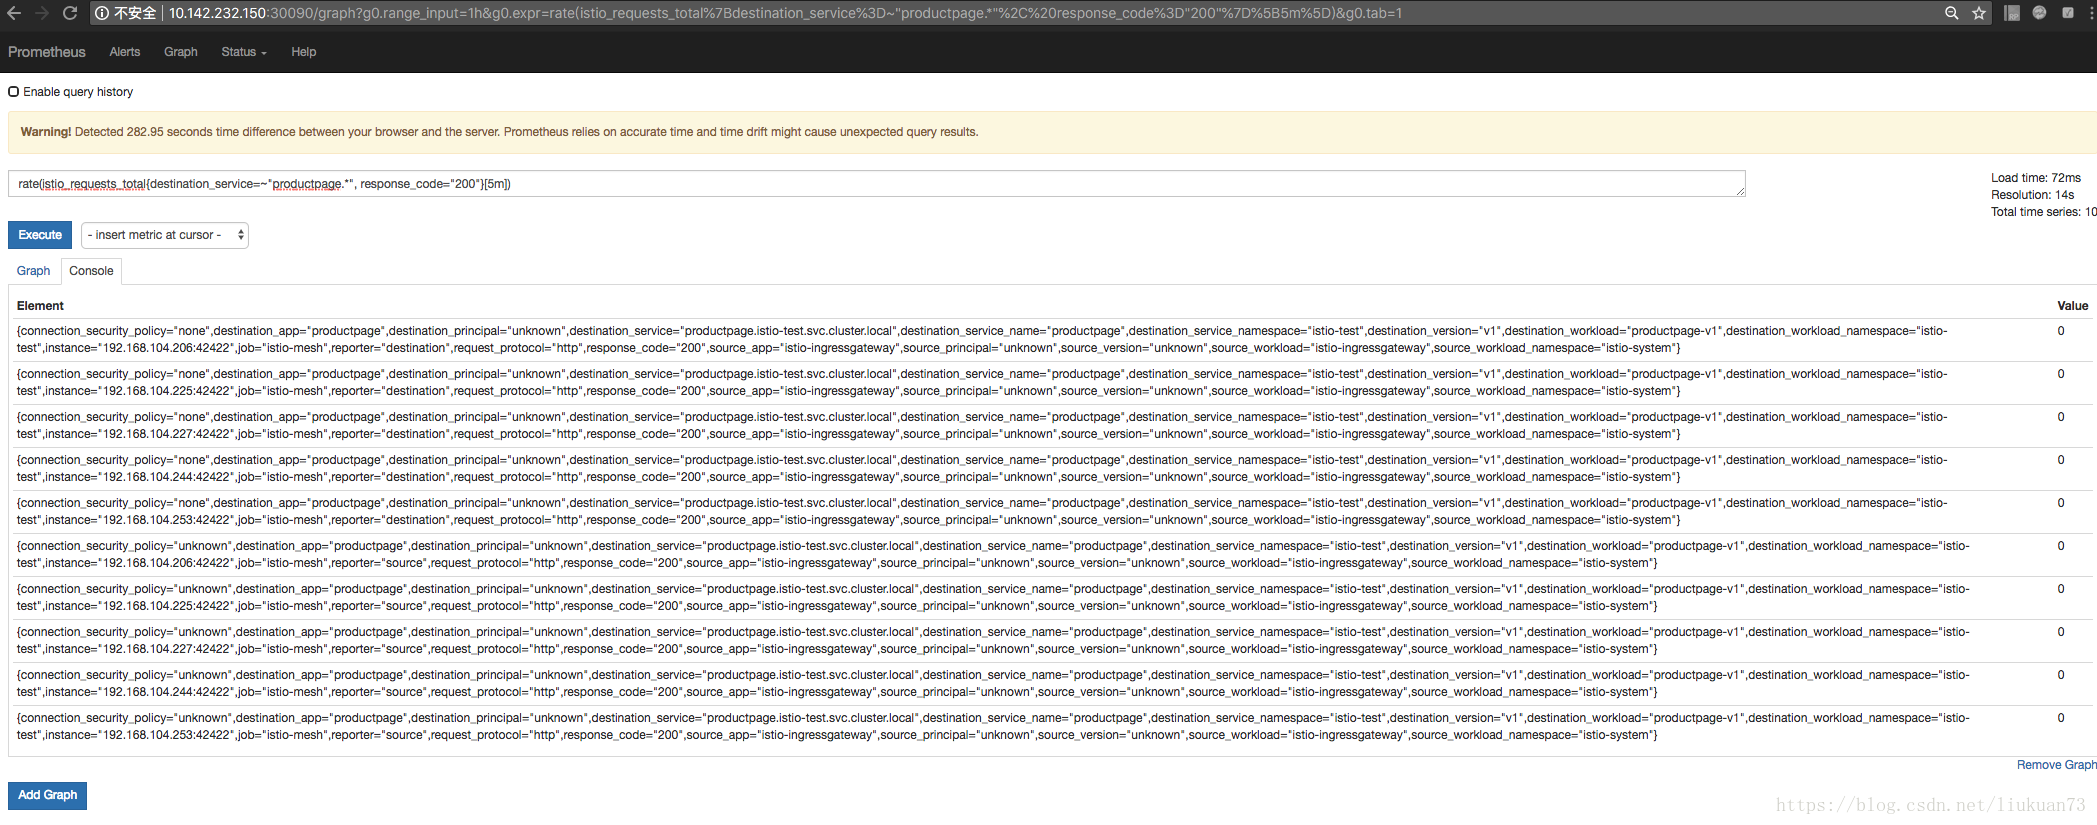
3.2.3 分布式追踪实验
这个实验展示Istio-enabled应用是怎样通过配置来收集跟踪信息的。跟踪功能是语言、框架、平台无关的。
将Jaeger dashboard通过nodePort暴露给外部访问:
kubectl edit svc jaeger-query -n istio-system

  ports:
  - name: query-http
    port: 16686
    protocol: TCP
    targetPort: 16686
    nodePort: 30686
  selector:
    app: jaeger
  sessionAffinity: None
  type: NodePort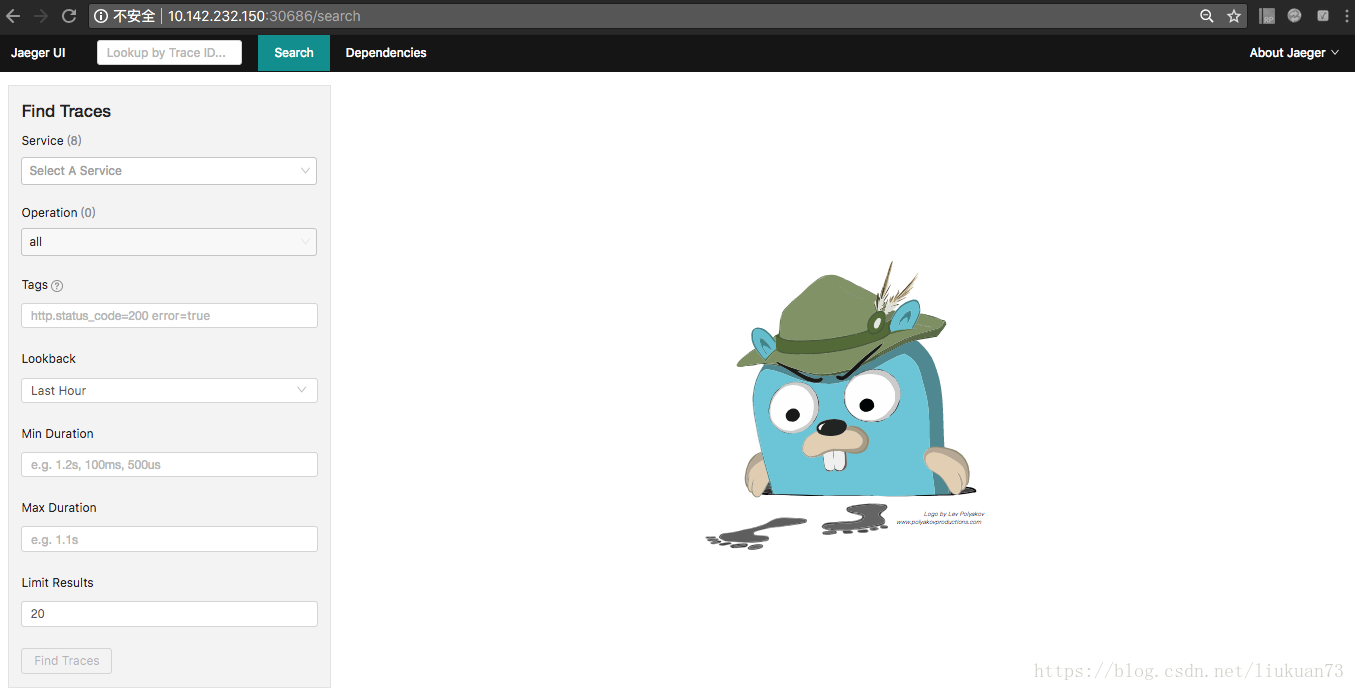
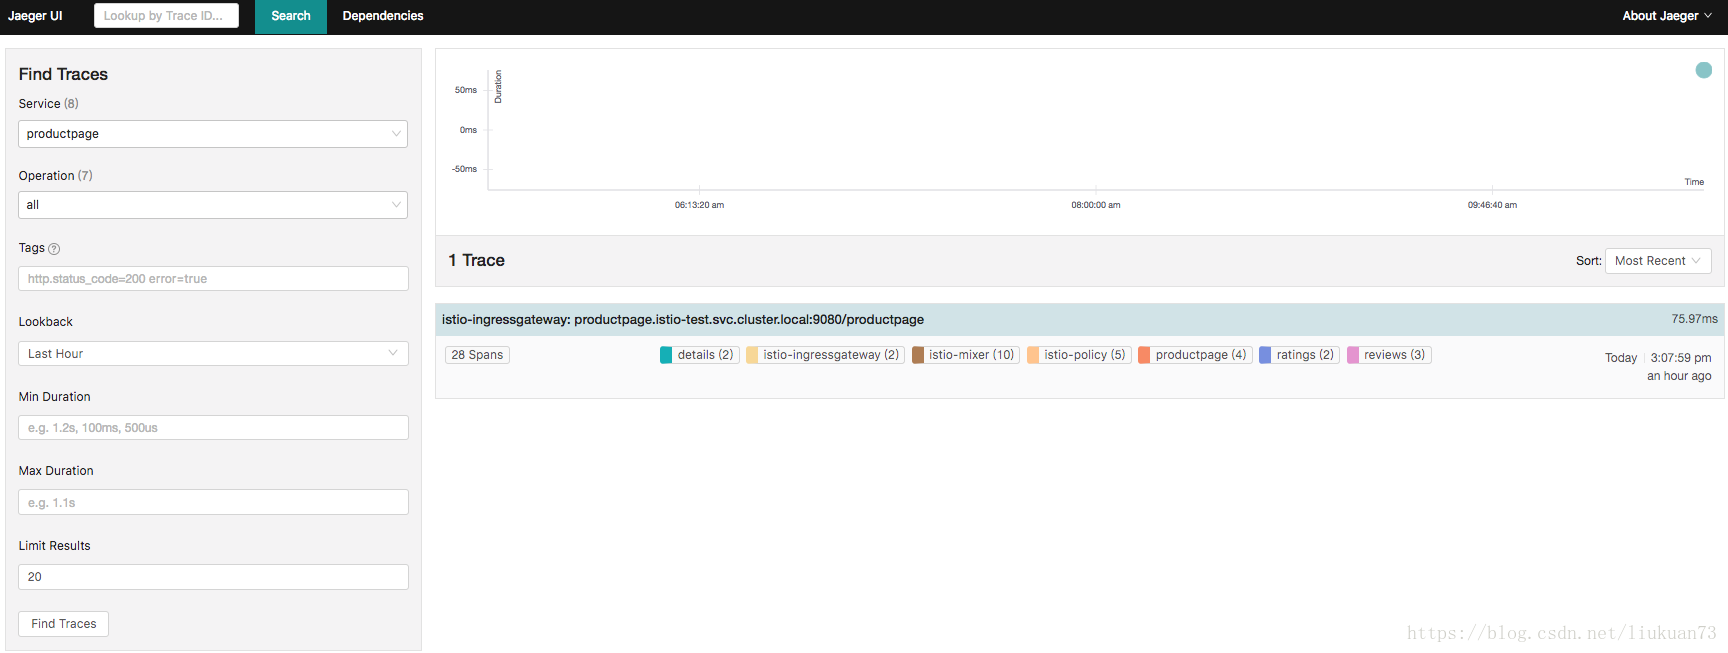
在 Jaeger dashboard里从Service下选择productpage,点击Find Traces 按钮,可以看到跟踪信息:
4. 参考:
1.官方部署文档
2.注入sidecar的一些细节
3.官方bookinfo示例应用
4.设置ingress
5.智能路由之–请求路由
6.智能路由之–故障注入
7.智能路由之–流量切换
8.深度检测之–指标收集
9.深度检测之–指标查询
10.深度检测之–分布式追踪
更多精彩内容,请订阅本人微信公众号:K8SPractice