mAP (mean Average Precision,平均精确率均值) for Object Detection
https://medium.com/@jonathan_hui/map-mean-average-precision-for-object-detection-45c121a31173
mAP is the metric to measure the accuracy of object detectors like Faster R-CNN, SSD, etc. It is the average of the maximum precisions at different recall values. It sounds complicated but actually pretty simple as we illustrate it with an example. But before that, we will do a quick recap on precision, recall and IoU first.
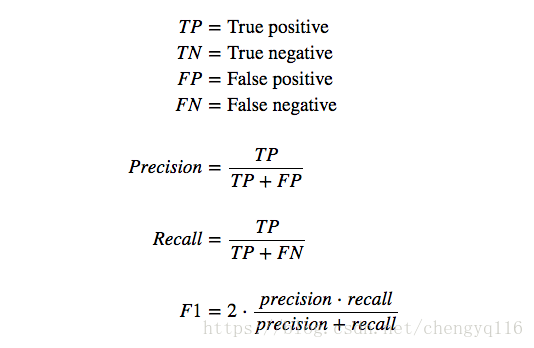
Precision & recall
precision:查准率,精确率
recall:查全率,召回率
Precision measures how accurate is your predictions. i.e. the percentage of your positive predictions are correct.
Recall measures how good you find all the positives. For example, we can find 80% of the possible positive cases in our top K predictions.
Here are their mathematical definitions:
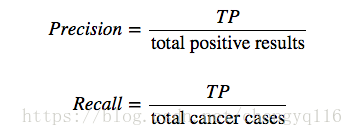
For example, in the testing for cancer:
IoU (Intersection over union)
交并比,交除以并
IoU measures how much overlap between 2 regions, This measures how good is our prediction in the object detector with the ground truth (the real object boundary).
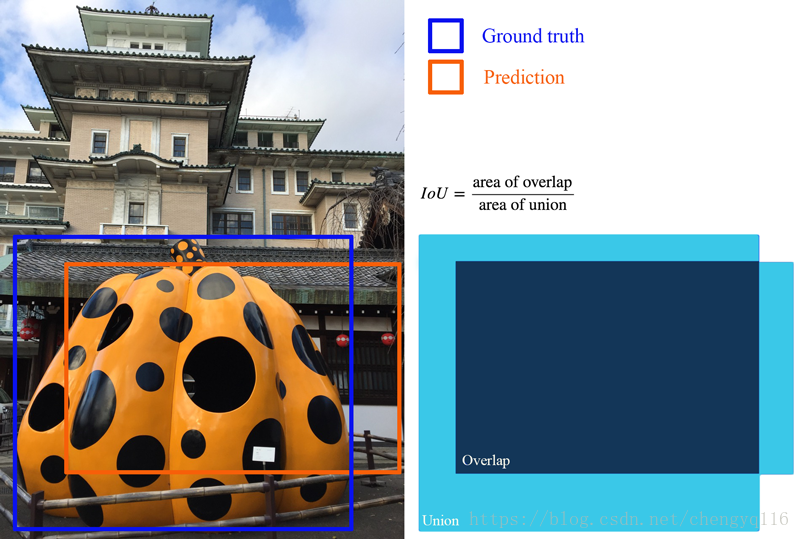
IoU definition
AP
Average Precision,AP:平均精确率
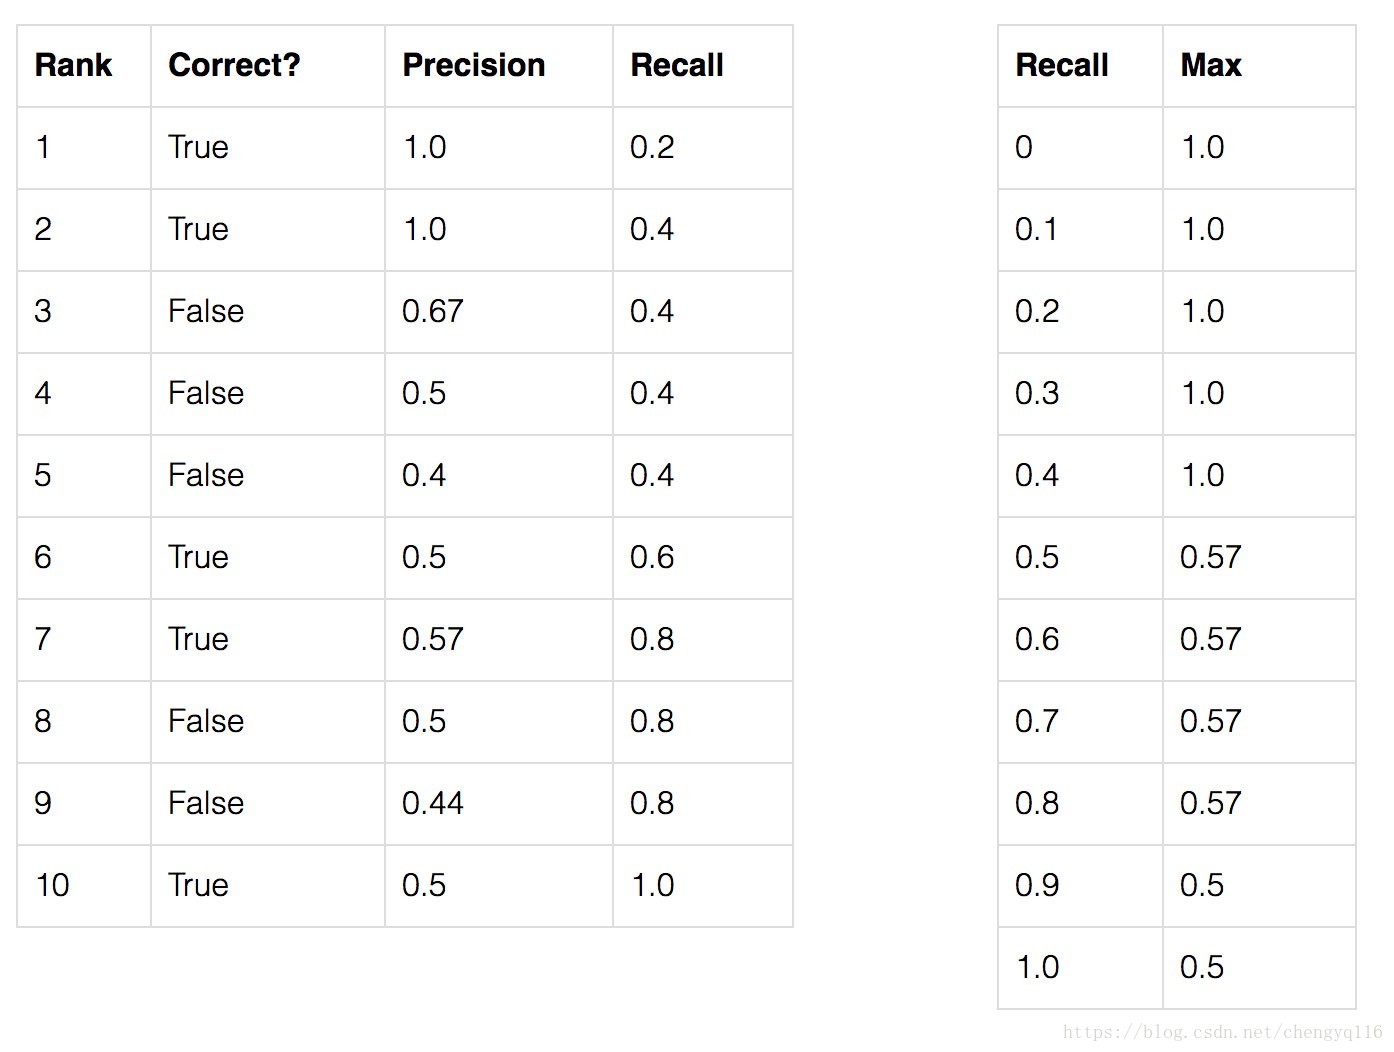
Let’s create a simple example to demonstrate the calculation of the average precision (AP). In our dataset, we have a total of 5 apples in the whole dataset. We collect all the predictions the model made for apples and rank it according to the predicted confidence level (from the highest confidence to the lowest). The second column indicates whether the prediction is correct or not. It is correct if it matches the ground truth and IoU ≥ 0.5.
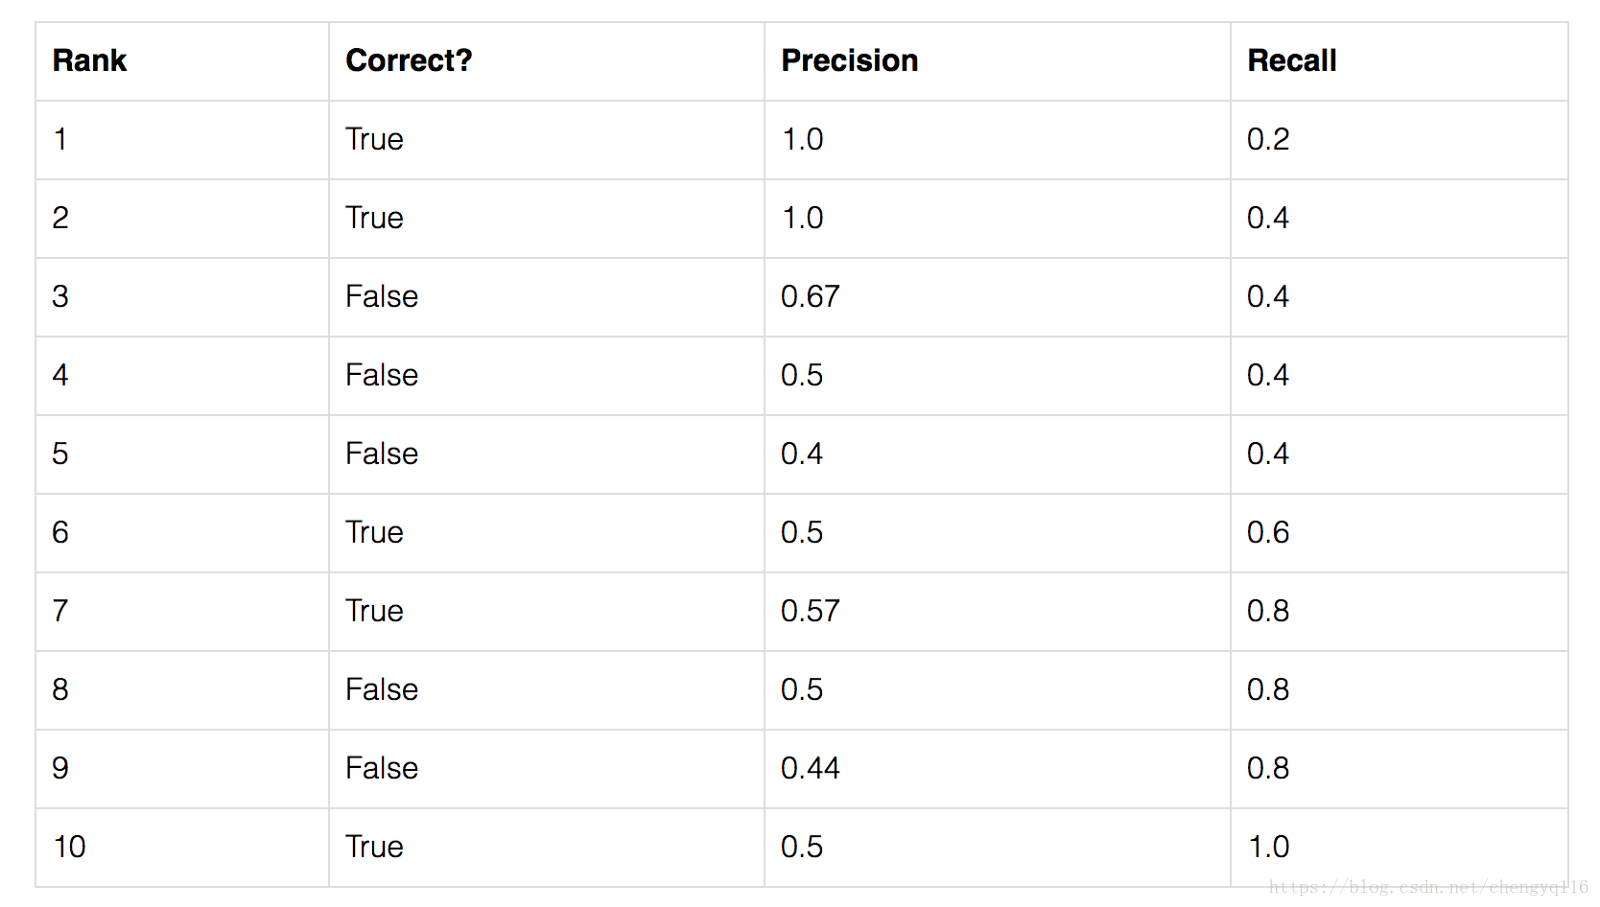
Let’s compute the precision and recall value for the row with rank #3.
Precision is the proportion of TP = 2/(2 + 1) = 2/3 = 0.67.
Recall is the proportion of TP out of the possible positives = 2/(2 + 3) = 2/5 = 0.4.
The recall value increases as we include more predictions but the precision will go up and down. Let’s plot the precision against the recall:
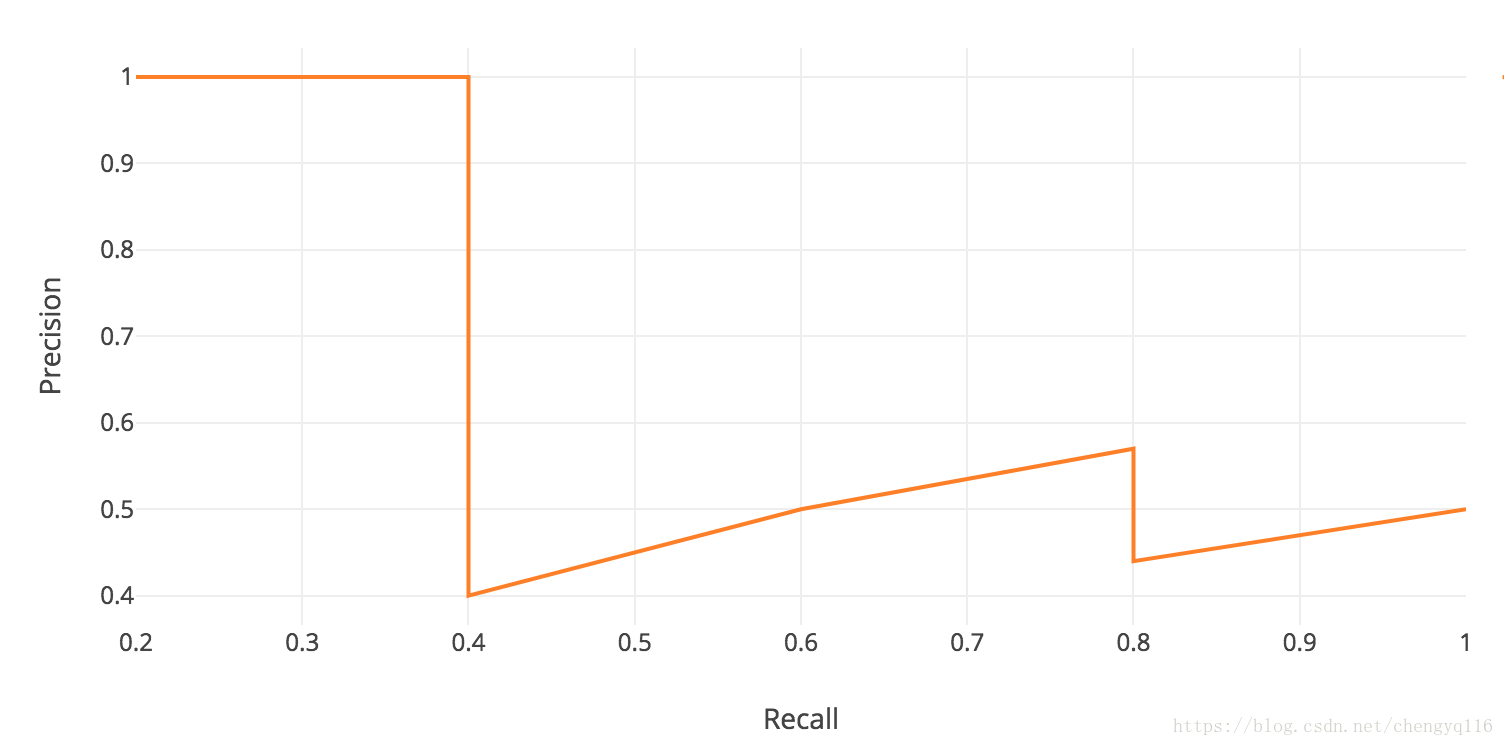
The idea of AP can be conceptually viewed as finding the area under the precision-recall graph (the orange plot). But we approximate such calculation by smoothing out the zigzag pattern first.
zigzag pattern:曲折图形
We plot the graph with recall ȓ value at 0, 0.1, 0.2, …, 0.9 and 1.0 and we replace the precision value with the maximum precision for any recall ≥ ȓ.

Actually, it is much easier to visualize this in the plot. We find the highest precision value (the green curve) at or to the right side of the recall values (0, 0.1, 0.2, …, 0.9 and 1.0).
AP (average precision) is computed as the average of maximum precision at these 11 recall levels:

This is close to finding the total area under the green curve and divides it by 11. Here are the more precise definitions.
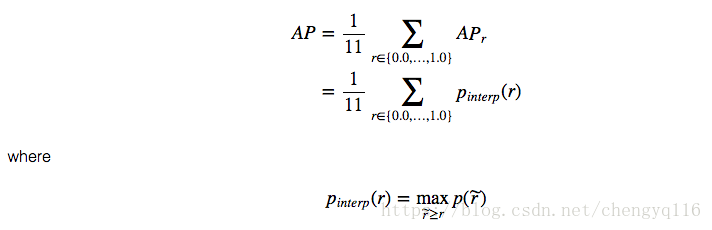
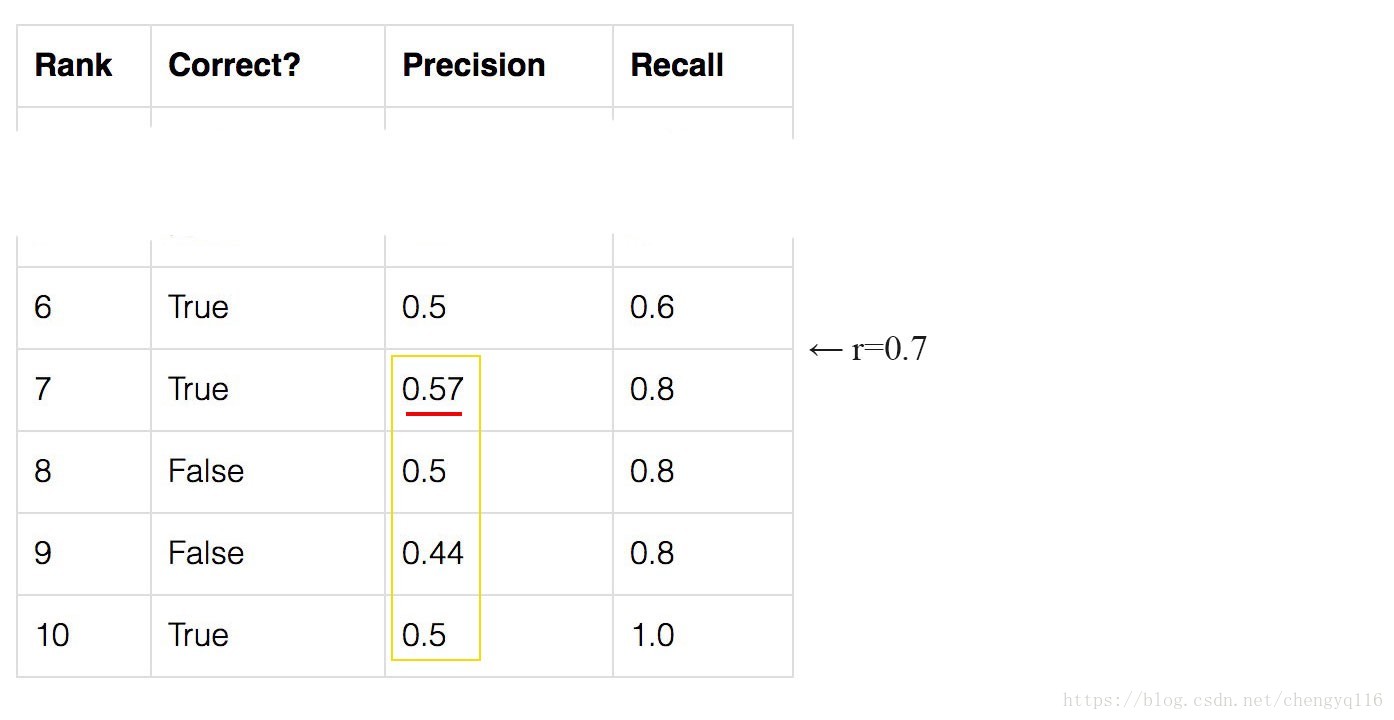
pinterp(0.7) is finding the maximum within the yellow box below:
In our example, AP = (5 × 1.0 + 4 × 0.57 + 2 × 0.5)/11
mAP is just the average over all classes. In many datasets, it is often called AP instead.
AP (Average Precision) in PASCAL VOC challenge
PASCAL VOC is a popular dataset for object detection. For the PASCAL VOC challenge, a prediction is positive if IoU > 0.5. However, if multiple detections of the same object are detected, it counts the first one as a positive while the rest as negatives. The mAP in PASCAL VOC is the same as AP we discussed.
COCO mAP
Latest research papers tend to give results for the COCO dataset only. For COCO, AP is the average over multiple IoU (the minimum IoU to consider a positive match). AP@[.5:.95] corresponds to the average AP for IoU from 0.5 to 0.95 with a step size of 0.05. For the COCO competition, AP is the average over 10 IoU levels on 80 categories (AP@[.50:.05:.95]: start from 0.5 to 0.95 with a step size of 0.05).
Here is the AP result for the YOLOv3 detector.
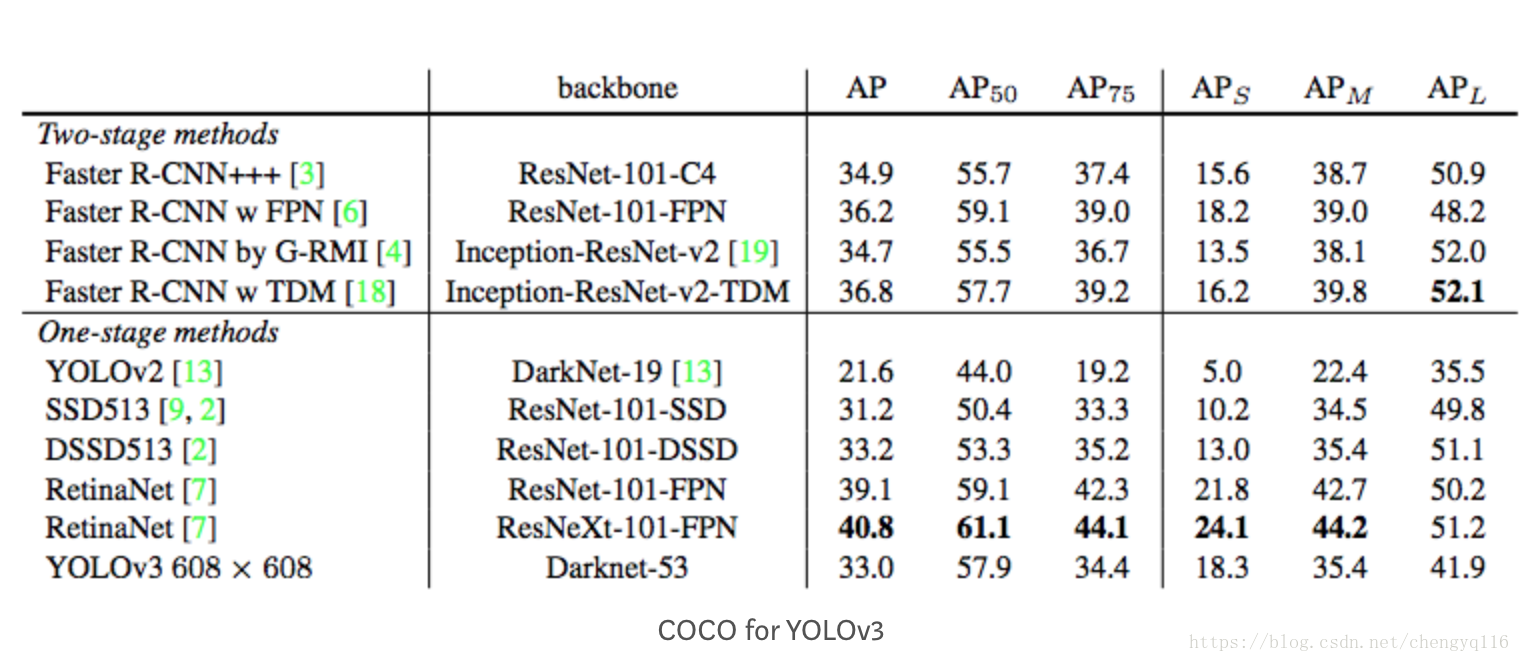
Source
https://pjreddie.com/media/files/papers/YOLOv3.pdf
[email protected] means the mAP with IoU=0.75.
More readings
Currently, we have 2 major types of deep network object detectors: region based and single shot. Here are 2 articles that elaborate more on these class of detectors:
What do we learn from region based object detectors (Faster R-CNN, R-FCN, FPN)?
https://medium.com/@jonathan_hui/what-do-we-learn-from-region-based-object-detectors-faster-r-cnn-r-fcn-fpn-7e354377a7c9
What do we learn from single shot object detectors (SSD, YOLOv3), FPN & Focal loss (RetinaNet)?
https://medium.com/@jonathan_hui/what-do-we-learn-from-single-shot-object-detectors-ssd-yolo-fpn-focal-loss-3888677c5f4d
This is the listing of articles covering object detection, GANs, self-driving car, reinforcement learning and meta-learning.
Index page for my articles in deep learning
https://medium.com/@jonathan_hui/index-page-for-my-articles-in-deep-learning-19821810a14
In general, recall increases and precision decreases. So what you are describing is that precision approaches 0 when your model reaches certain recall level. So the last few terms does not improve your mAP score.
How is 0.6 confidence in one model comparing with 0.4 confidence in another model? The answer is likely don’t know. What is more important is how your top 10 predictions compare with my top 10. That is why mAP rank the choice using the confidence score. Should I just send predictions higher than 0.5 only? If you think anything lower than 0.5 are garbage and will not improve your recall without dropping precision close to 0, then you can stop sending those to the scoring server.
APr(0) can be smaller than 1. As long as the first one is FP, max(TP/(FP + TP)) < 1.
An alternative way to see that is there are 11 values APr(0), APr(1) … APr(10) and there are 11 bars in the chart. What is the total area of the bars? The AP area is a “conceptually view”. But the exact mathematical equation is more. Once you realize APr(0) is not one, it makes sense to use it to compute the average also. Hope the bar chart visualization is better.
Wordbook
mean Average Precision,mAP:平均精确率均值
Average Precision,AP:平均精确率
Single Shot MultiBox Detector,SSD
References
https://medium.com/@jonathan_hui/map-mean-average-precision-for-object-detection-45c121a31173
https://github.com/rafaelpadilla/Object-Detection-Metrics
https://medium.com/@jonathan_hui