precision (查准率,精确率) / recall (查全率,召回率) / average precision (平均精确率)
It’s a bird… it’s a plane… it… depends on your classifier’s threshold
https://sanchom.wordpress.com/2011/09/01/precision-recall/
Evaluation of an information retrieval system (a search engine, for example) generally focuses on two things:
1. How relevant are the retrieved results? (precision)
precision (查准率,精确率)
2. Did the system retrieve many of the truly relevant documents? (recall)
recall (查全率,召回率)
For those that aren’t familiar, I’ll explain what precision and recall are, and for those that are familiar, I’ll explain some of the confusion in the literature when comparing precision-recall curves.
1. Geese and airplanes
大雁和飞机
Suppose you have an image collection consisting of airplanes and geese.
假设现在有这样一个测试集,测试集中的图片只由大雁和飞机两种图片组成。
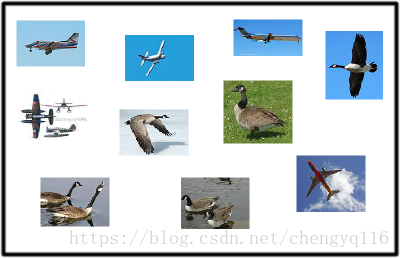
You want your system to retrieve all the airplane images and none of the geese images.
假设你的分类系统最终的目的是:能取出测试集中所有飞机的图片,而不是大雁的图片。
Given a set of images that your system retrieves from this collection, we can define four accuracy counts:
True positives: Airplane images that your system correctly retrieved
飞机的图片被系统正确的识别为飞机。
True negatives: Geese images that your system correctly did not retrieve
大雁的图片没有被识别出来,系统正确地认为它们是大雁。
False positives: Geese images that your system incorrectly retrieved, believing them to be airplanes
大雁的图片被系统错误地识别成了飞机。
False negatives: Airplane images that your system did incorrectly did not retrieve, believing them to be geese
飞机的图片没有被识别出来,系统错误地认为它们是大雁。
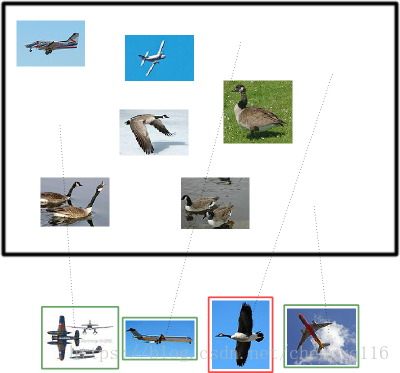
In this example retrieval, there are three true positives and one false positive.
Using the terms I just defined, in this example retrieval, there are three true positives and one false positive. How many false negatives are there? How many true negatives are there?
在识别出的这四张照片中:
true positives: 有三个,画绿色框的飞机。
false positives: 有一个,画红色框的大雁。
There are two false negatives (the airplanes that the system failed to retrieve) and four true negatives (the geese that the system did not retrieve).
没被识别出来的六张图片中:
true negatives: 有四个,这四个大雁的图片,系统正确地没有把它们识别成飞机。
false negatives: 有两个,两个飞机没有被识别出来,系统错误地认为它们是大雁。
2. Precision and recall
精确率与召回率
Now, you’ll be able to understand more exactly what precision and recall are.
Precision is the percentage true positives in the retrieved results. That is:
Precision 是在识别出来的图片中,true positives 所占的比率:
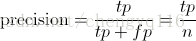
where n is equal to the total number of images retrieved (tp + fp).
其中 n = (true positives + false positives),即系统一共识别出来多少张图片。
Recall is the percentage of the airplanes that the system retrieves. That is:
Recall 是被正确识别出来的飞机个数与测试集中所有飞机的个数的比值:
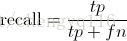
Recall 的分母为 (true positives + false negatives),这两个值的和是一共有多少张飞机的图片。
In our example above, with 3 true positives, 1 false positive, 4 true negatives, and 2 false negatives, precision = 0.75, and recall = 0.6.
precision = 3 / (3 + 1) = 0.75
recall = 3 / (3 + 2) = 0.6
75% of the retrieved results were airplanes, and 60% of the airplanes were retrieved.
在识别出的结果中,飞机的图片占 75%。
在所有的飞机图片中,60% 的飞机被正确的识别为飞机。
3. Adjusting the threshold
调整阈值
What if we’re not happy with that performance? We could ask the system to return more examples. This would be done be relaxing our threshold of what we want our system to consider as an airplane. We could also ask our system to be more strict, and return fewer examples. In our example so far, the system retrieved four examples. That corresponds to a particular threshold (shown below by a blue line). The system retrieved the examples that appeared more airplane-like than that threshold.
通过调整阈值,来选择让系统识别出多少图片,进而改变 Precision 或 Recall 的值。
设定某种阈值 (蓝色虚线),系统识别出了四张图片,如下图中所示。
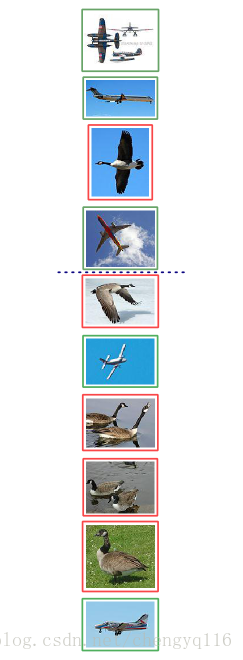
This is a hypothetical ordering that our airplane retrieval system could give to the images in our collection. More airplane-like are at the top of the list. The blue line is the threshold that gave our example retrieval.
分类系统认为大于阈值 (蓝色虚线之上) 的四个图片更像飞机。
We can move that threshold up and down to get a different set of retrieved documents. At each position of the threshold, we would get a different precision and recall value. Specifically, if we retrieved only the top example, precision would be 100% and recall would be 20%. If we retrieved the top two examples, precision would still be 100%, and recall will have gone up to 40%. The following chart gives precision and recall for the above hypothetical ordering at all the possible thresholds.
我们可以通过改变阈值 (也可以看作上下移动蓝色的虚线),来选择让系统识别能出多少个图片。当然阈值的变化会导致 Precision 与 Recall 值发生变化。比如,把蓝色虚线放到第一张图片下面,也就是说让系统只识别出最上面的那张飞机图片,那么 Precision 的值就是 100%,而 Recall 的值则是 20%。如果把蓝色虚线放到第二张图片下面,也就是说让系统只识别出最上面的前两张图片,那么 Precision 的值还是 100%,而 Recall 的值则增长到是 40%。
下图为不同阈值条件下,Precision 与 Recall 的变化情况。
| Retrieval cutoff | Precision | Recall |
|---|---|---|
| Top 1 image | 100% = 1 / (1 + 0) = 1 / 1 | 20% = 1 / (1 + 4) = 1 / 5 |
| Top 2 images | 100% = 2 / (2 + 0) = 2 / 2 | 40% = 2 / (2 + 3) = 2 / 5 |
| Top 3 images | 66% = 2 / (2 + 1) = 2 / 3 | 40% = 2 / (2 + 3) = 2 / 5 |
| Top 4 images | 75% = 3 / (3 + 1) = 3 / 4 | 60% = 3 / (3 + 2) = 3 / 5 |
| Top 5 images | 60% = 3 / (3 + 2) = 3 / 5 | 60% = 3 / (3 + 2) = 3 / 5 |
| Top 6 images | 66% = 4 / (4 + 2) = 4 / 6 | 80% = 4 / (4 + 1) = 4 / 5 |
| Top 7 images | 57% = 4 / (4 + 3) = 4 / 7 | 80% = 4 / (4 + 1) = 4 / 5 |
| Top 8 images | 50% = 4 / (4 + 4) = 4 / 8 | 80% = 4 / (4 + 1) = 4 / 5 |
| Top 9 images | 44% = 4 / (4 + 5) = 4 / 9 | 80% = 4 / (4 + 1) = 4 / 5 |
| Top 10 images | 50% = 5 / (5 + 5) = 5 / 10 | 100% = 5 / (5 + 0) = 5 / 5 |
4. Precision-recall curves
A good way to characterize the performance of a classifier is to look at how precision and recall change as you change the threshold. A good classifier will be good at ranking actual airplane images near the top of the list, and be able to retrieve a lot of airplane images before retrieving any geese: its precision will stay high as recall increases. A poor classifier will have to take a large hit in precision to get higher recall. Usually, a publication will present a precision-recall curve to show how this tradeoff looks for their classifier. This is a plot of precision p as a function of recall r.
如果你想评估一个分类器的性能,一个比较好的方法就是:观察当阈值变化时,precision 与 recall 值的变化情况。如果一个分类器的性能比较好,那么它应该有如下的表现:被识别出的图片中飞机所占的比重比较大,并且在识别出大雁之前,尽可能多地正确识别出飞机,也就是让 recall 值增长的同时保持 precision 的值在一个很高的水平。而性能比较差的分类器可能会损失很多 precision 值才能换来 recall 值的提高。通常情况下,文章中都会使用 precision-recall 曲线,来显示出分类器在 precision 与 recall 之间的权衡。
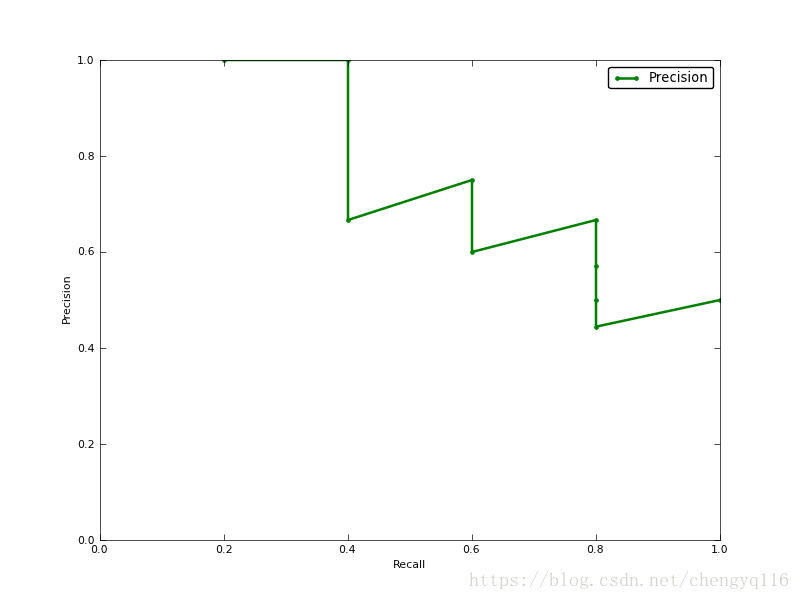
The precision-recall curve for our example airplane classifier. It can achieve 40% recall without sacrificing any precision, but to get 100% recall, its precision drops to 50%.
上图就是分类器的 precision-recall 曲线,在不损失精度的条件下它能达到 40% recall。而当 recall 达到 100% 时,precision 降低到 50%。
5. Average precision
平均精确率
Rather than comparing curves, its sometimes useful to have a single number that characterizes the performance of a classifier. A common metric is the average precision. This can actually mean one of several things.
相比较曲线图,在某些时候还是一个具体的数值能更直观地表现出分类器的性能。通常情况下都是用 average precision 来作为这一度量标准。
5.1 Average precision
平均精确率
Strictly, the average precision is precision averaged across all values of recall between 0 and 1:
在这个积分函数中,其中 p 代表 precision,r 代表 recall,p 是一个以 r 为参数的函数。

That’s equal to taking the area under the curve. In practice, the integral is closely approximated by a sum over the precisions at every possible threshold value, multiplied by the change in recall:
实际上这一积分极其接近于:对每一种阈值分别求 (precision 值) 乘以 (recall 值的变化情况),再把所有阈值下求得的乘积值进行累加。
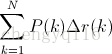
where N is the total number of images in the collection, P(k) is the precision at a cutoff of k images, and delta r(k) is the change in recall that happened between cutoff k-1 and cutoff k.
在这一公式中,N 代表测试集中所有图片的个数,P(k) 表示在能识别出 k 个图片的时候 precision 的值,而 delta r(k) 则表示识别图片个数从 k-1 变化到 k 时 (通过调整阈值) recall 值的变化情况。
In our example, this is (1 * 0.2) + (1 * 0.2) + (0.66 * 0) + (0.75 * 0.2) + (0.6 * 0) + (0.66 * 0.2) + (0.57 * 0) + (0.5 * 0) + (0.44 * 0) + (0.5 * 0.2) = 0.782.
= (1 * (0.2 - 0)) + (1 * (0.4 - 0.2)) + (0.66 * (0.4 - 0.4)) + (0.75 * (0.6 - 0.4)) + (0.6 * (0.6 - 0.6)) + (0.66 * (0.8 - 0.6)) + (0.57 * (0.8 - 0.8)) + (0.5 * (0.8 - 0.8)) + (0.44 * (0.8 - 0.8)) + (0.5 * (1 - 0.8))
= (1 * 0.2) + (1 * 0.2) + (0.66 * 0) + (0.75 * 0.2) + (0.6 * 0) + (0.66 * 0.2) + (0.57 * 0) + (0.5 * 0) + (0.44 * 0) + (0.5 * 0.2)
= 0.782.
Notice that the points at which the recall doesn’t change don’t contribute to this sum (in the graph, these points are on the vertical sections of the plot, where it’s dropping straight down). This makes sense, because since we’re computing the area under the curve, those sections of the curve aren’t adding any area.
通过计算可以看到,那些 recall 值没有变化的地方 (加粗数值),对增加 average precision 值没有贡献。
5.2 Interpolated average precision
Some authors choose an alternate approximation that is called the interpolated average precision. Often, they still call it average precision. Instead of using P(k), the precision at a retrieval cutoff of k images, the interpolated average precision uses:
不同于 approximated average precision,一些作者选择另一种度量性能的标准:interpolated average precision。这一新的算法不再使用 P(k),也就是说,不再使用当系统识别出 k 个图片的时候 precision 的值与 recall 变化值相乘。

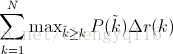
In other words, instead of using the precision that was actually observed at cutoff k, the interpolated average precision uses the maximum precision observed across all cutoffs with higher recall. The full equation for computing the interpolated average precision is:
每次使用在 k 后面的阈值的 precision 中,最大值的那个 precision 值与 recall 的变化值相乘。
Visually, here’s how the interpolated average precision compares to the approximated average precision (to show a more interesting plot, this one isn’t from the earlier example):
需要注意的是,为了让特征更明显,图片中使用的参数与上面所说的例子无关。
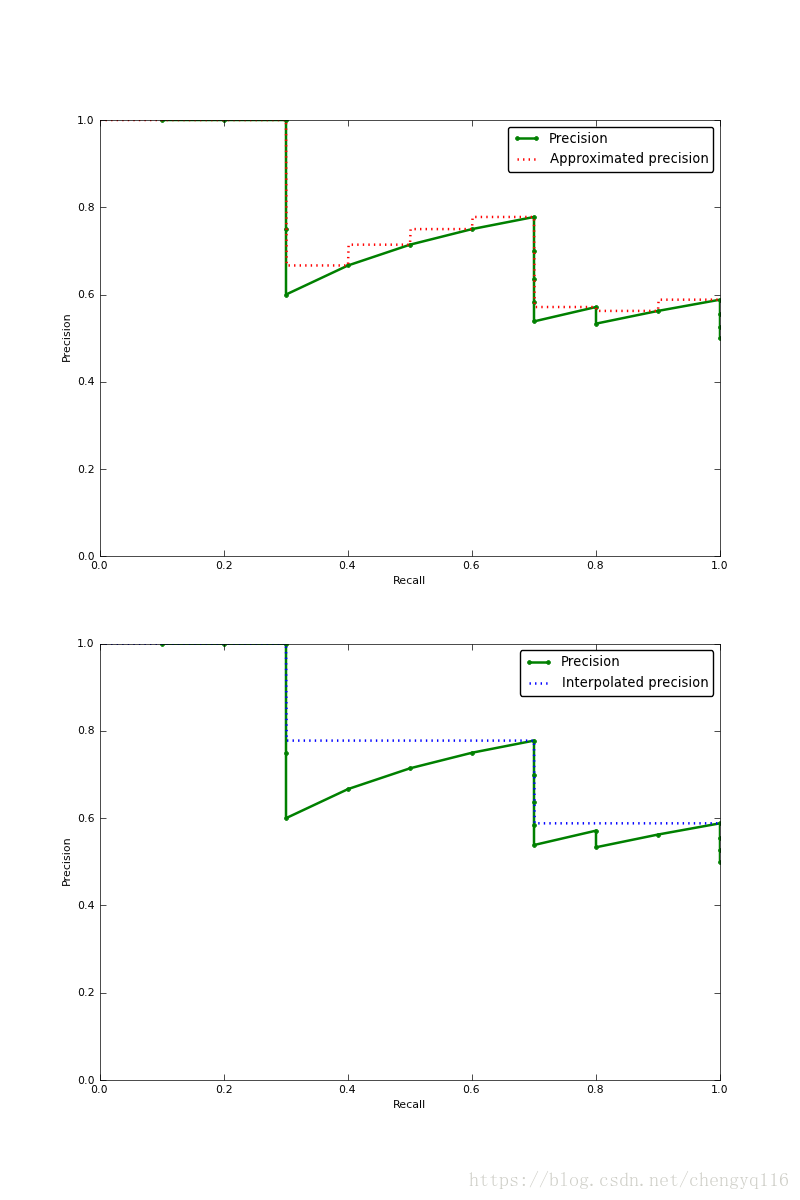
The approximated average precision closely hugs the actually observed curve. The interpolated average precision over estimates the precision at many points and produces a higher average precision value than the approximated average precision.
很明显 approximated average precision 与精度曲线挨的很近,而使用 interpolated average precision 算出的 average precision 值明显要比 approximated average precision 的方法算出的要高。
Further, there are variations on where to take the samples when computing the interpolated average precision. Some take samples at a fixed 11 points from 0 to 1: {0, 0.1, 0.2, …, 0.9, 1.0}. This is called the 11-point interpolated average precision. Others sample at every k where the recall changes.
6 Confusion
Some important publications use the interpolated average precision as their metric and still call it average precision. For example, the PASCAL Visual Objects Challenge has used this as their evaluation metric since 2007. I don’t think their justification is strong. They say, “the intention in interpolating the precision/recall curve in this way is to reduce the impact of the “wiggles” in the precision/recall curve”. Regardless, everyone compares against each other on this metric, so within the competition, this is not an issue. However, the rest of us need to be careful when comparing “average precision” values against other published results. Are we using the VOC’s interpolated average precision, while previous work had used the non-interpolated average precision? This would incorrectly show improvement of a new method when compared to the previous work.
一些很重要的文章都是用 interpolated average precision 作为度量方法,并且直接称算出的值为 average precision。PASCAL Visual Objects Challenge 从 2007 年开始就是用这一度量制度,他们认为这一方法能有效地减少 precision-recall 曲线中的抖动。所以在比较文章中 average precision 值的时候,最好先弄清楚它们使用的是哪种度量方式。
7 Summary
Precision and recall are useful metrics for evaluating the performance of a classifier.
Precision and recall vary with the strictness of your classifier’s threshold.
There are several ways to summarize the precision-recall curve with a single number called average precision; be sure you’re using the same metric as the previous work that you’re comparing with.
Wordbook
precision:查准率,精确率
recall:查全率,召回率
accuracy:准确率
References
https://sanchom.wordpress.com/2011/09/01/precision-recall/
https://medium.com/@jonathan_hui/map-mean-average-precision-for-object-detection-45c121a31173