一、功能描述
在ECharts中可以直观的显示对数据库中信息的统计结果,但是ECharts处理只能看到数据的处理结果而不能看到,统计出来的数据详细信息。
本篇博客主要实现点击ECharts的统计信息时候,显示统计出该数据的详细信息。可结合以前的一篇博客进行理解:https://blog.csdn.net/wilson_m/article/details/78804153。
二、前台代码
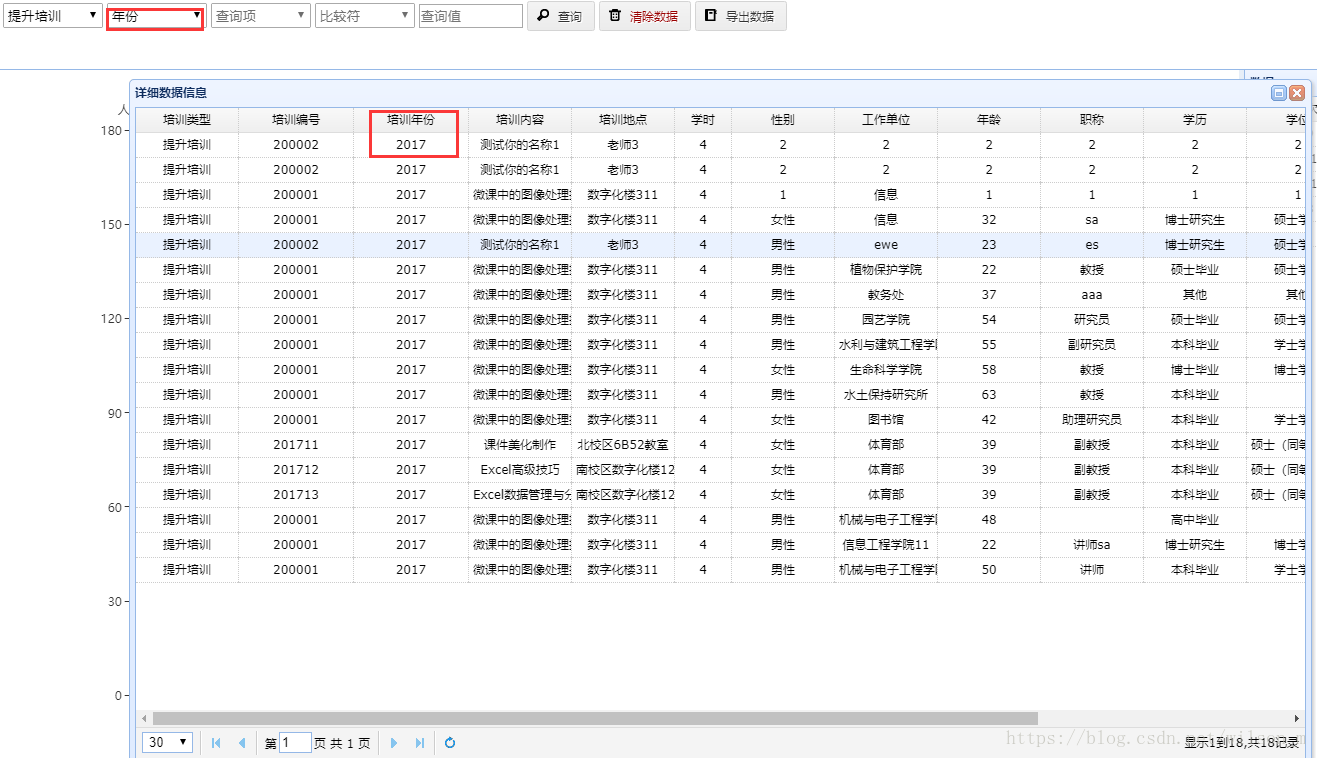
//数据网格,用于展示Echarts统计的详细信息,默认不显示
 <div  id="window1" class="easyui-window" title="详细数据信息" style="width: 80%;height: 80%"  data-options="closed:true,minimizable:false,collapsible:false">
        <table  id="dg1" class="easyui-datagrid"
                data-options="
               method:'get',
               border:false,
               singleSelect:true,
               fit:true,
               collapsible:false,
               pagination:true,
               fitColumns:true">
            <thead>
            <tr>
                <th data-options="field:'traintype', align:'center',width:'9%'">培训类型</th>
                <th data-options="field:'trainNo', align:'center',width:'10%'">培训编号</th>
                <th data-options="field:'trainYear', align:'center',width:'10%'">培训年份</th>
                <th data-options="field:'traincontent',align:'center',width:'9%'">培训内容</th>
                <th data-options="field:'trainAddress',align:'center',width:'9%'">培训地点</th>
                <th data-options="field:'trainHours', align:'center',width:'5%'">学时</th>
                <th data-options="field:'teacherGender', align:'center',width:'9%'">性别</th>
                <th data-options="field:'workUnit', align:'center',width:'9%'">工作单位</th>
                <th data-options="field:'teacherAge', align:'center',width:'9%'">年龄</th>
                <th data-options="field:'teacherTitle', align:'center',width:'9%'">职称</th>
                <th data-options="field:'educationBackground', align:'center',width:'9%'">学历</th>
                <th data-options="field:'teacherDegree', align:'center',width:'9%'">学位</th>
                <th data-options="field:'trainSpeaker', align:'center',width:'9%'">主讲人</th>
                <th data-options="field:'teacherState',align:'center',width:'7%'">状态</th>
                <th data-options="field:'grade',align:'center',width:'9%'">成绩</th>
            </tr>
            </thead>
        </table>
    </div>


//柱状图
 var myChart = echarts.init(document.getElementById('main'));
        option = {
            tooltip: {
                trigger: 'axis'
            },
            legend: {
                data:['柱状图','折线图']
            },
            xAxis: [
                {
                    type: 'category',
                    name: '分组项',
                    data: data1
                }
            ],
            yAxis: [
                {
                    type: 'value',
                    name: '人次',
                    min: 0,
                }
            ],
            series: [
                {
                    name:'人次',
                    type:'line',
                    itemStyle : {  /*设置折线颜色*/
                        normal : {
                            color:'#e3de46'
                        }
                    },
                    data: data2
                },
                {
                    name:'分组项',
                    type:'bar',
                    /*设置柱状图颜色*/
                    itemStyle: {
                        normal: {
                            color:'#2692d2',
                            /*柱形图上每个柱子顶端中间显示的数据*/
                            label: {
                                show: true,
                                position: 'top',
                                formatter: '{c}'
                            }
                        }
                    },
                    data: data2
                }
            ]
        };


//柱状图鼠标单击事件处理
        myChart.on('click', function (params) {
            if (params.componentType === 'series') {

                //点击柱状图中的一种中触发函数
                if (params.seriesType === 'bar') {

                    //获取每一个柱状图对应的横坐标的元素值
                    var selectItemValueRec=params.name;

                    //对datagrid进行展示数据信息
                    $('#dg1').datagrid({
                        url: '/getStatisticDataGridList',
                        method: 'get',
                        queryParams: {
                        //请求的三个参数
                            sourceItemValue: sourceItemValue,
                            groupItemValue: groupItemValue,
                            selectItemValueRec: selectItemValueRec
                        },
                        border: false,
                        singleSelect: true,
                        fit: true,
                        collapsible: false,
                        pagination: true,
                        pageSize:30,
                        pageList:[10,30,50,70,100],
                        fitColumns: true,
                    });
                    //显示数据网格对话框
                    $('#window1').window('open');
                }
            }
        });
三、Java后台代码
//mapper层代码
@Select("select * from v_all where traintype = #{sourceItemValue} and ${selectItemValue}=#{selectItemValueRec} limit #{startRecord},#{pageSize}")
public List<All> getTableDataListBySelectOnDataGrid(@Param( "sourceItemValue" ) String sourceItemValue, @Param( "selectItemValue" ) String selectItemValue, @Param( "selectItemValueRec" ) String selectItemValueRec, @Param( "startRecord" ) int startRecord, @Param( "pageSize" ) int pageSize);
@Select("select count(*) from v_all where traintype = #{sourceItemValue} and ${selectItemValue}=#{selectItemValueRec}")
public int getTableDataListBySelectOnDataGridNum(@Param( "sourceItemValue" ) String sourceItemValue, @Param( "selectItemValue" ) String selectItemValue, @Param( "selectItemValueRec" ) String selectItemValueRec);
//service层代码
public List<All> getTableDataListBySelectOnDataGrid(String sourceItemValue, String selectItemValue, String selectItemValueRec, int startRecord, int pageSize){
return integratedQueryMapper.getTableDataListBySelectOnDataGrid(sourceItemValue, selectItemValue, selectItemValueRec,startRecord,pageSize);
}
public int getTableDataListBySelectOnDataGridNum(String sourceItemValue,String selectItemValue, String selectItemValueRec){
return integratedQueryMapper.getTableDataListBySelectOnDataGridNum(sourceItemValue, selectItemValue, selectItemValueRec);
}
//controller层代码
@RequestMapping(value = "/getStatisticDataGridList",method = {RequestMethod.GET, RequestMethod.POST})
@ResponseBody
public Map getStatisticDataGridList(@RequestParam("sourceItemValue") String sourceItemValue, @RequestParam("groupItemValue") String groupItemValue, @RequestParam("selectItemValueRec") String selectItemValueRec, HttpSession session,HttpServletRequest request){
int page=Integer.parseInt(request.getParameter("page"));//分页,第n页
int pageSzie=Integer.parseInt(request.getParameter("rows"));//每页数据记录数
if(page<=0){
page=1;
}
int startRecord=(page-1)*pageSzie;
int total;
//查询所有数据总数
total = integratedQueryService.getTableDataListBySelectOnDataGridNum(sourceItemValue, groupItemValue, selectItemValueRec);
//查询数据
List<All> getStatisticDataGridList = integratedQueryService.getTableDataListBySelectOnDataGrid(sourceItemValue, groupItemValue, selectItemValueRec, startRecord, pageSzie);
Map resultMap=new HashMap();
resultMap.put("total",total);
resultMap.put("rows",getStatisticDataGridList);
return resultMap;
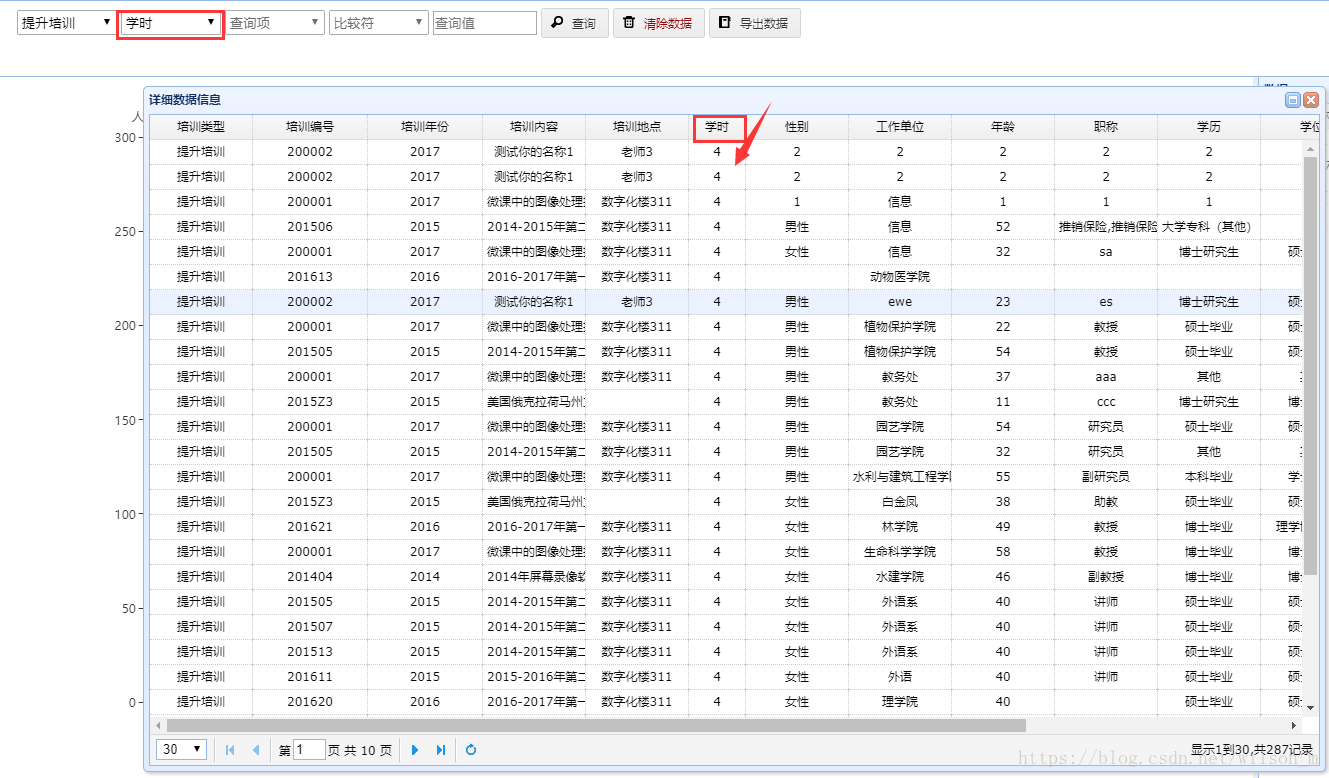
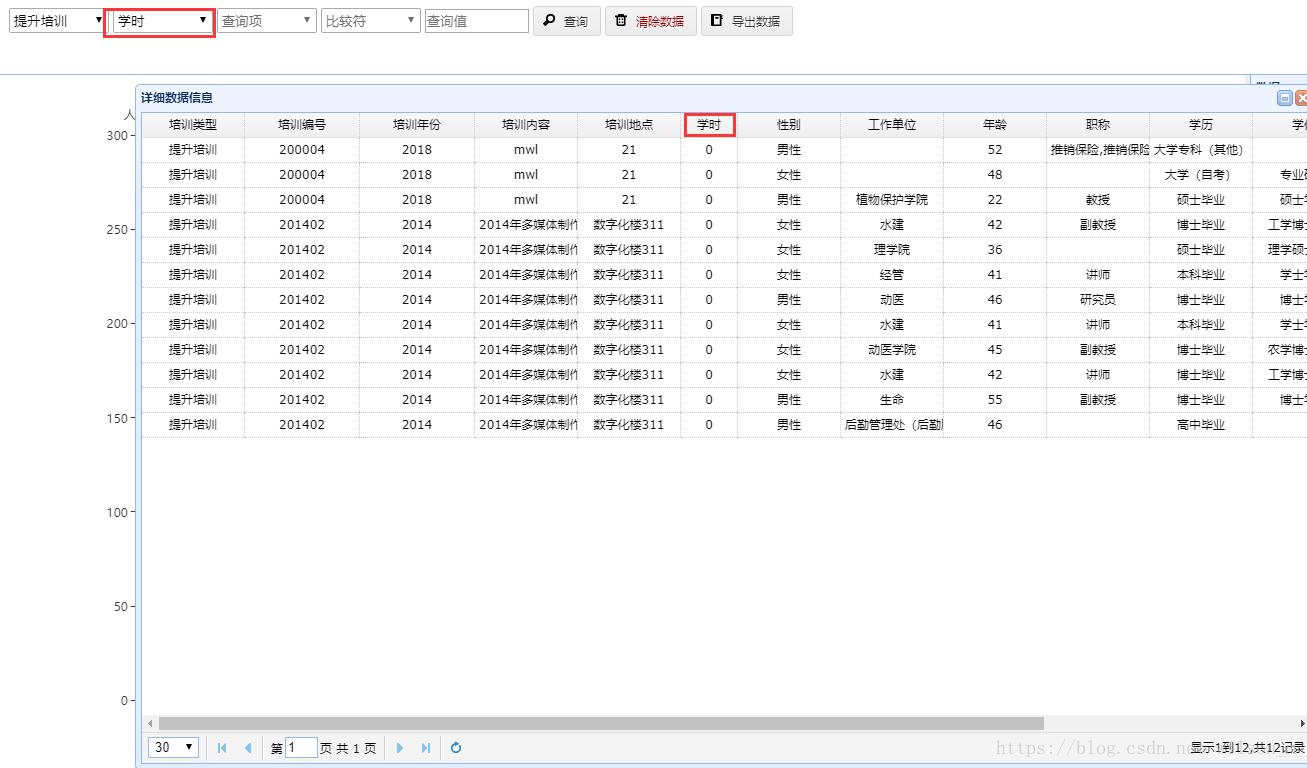
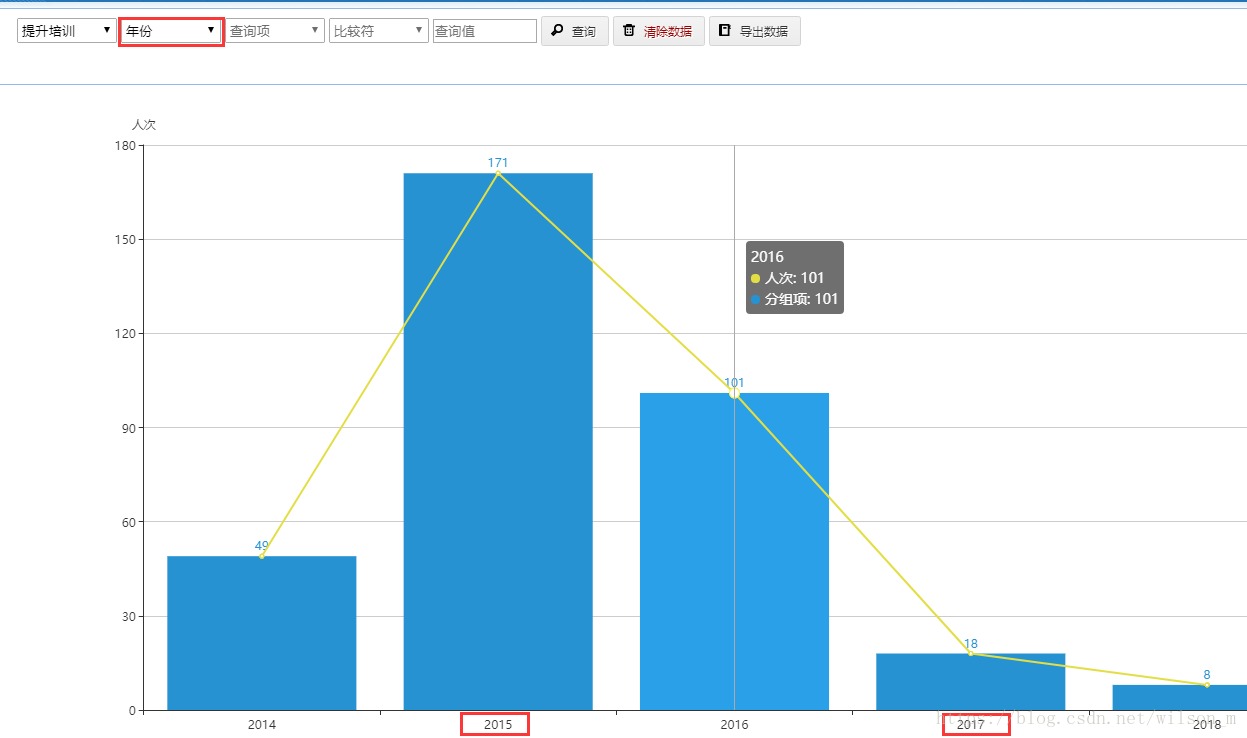
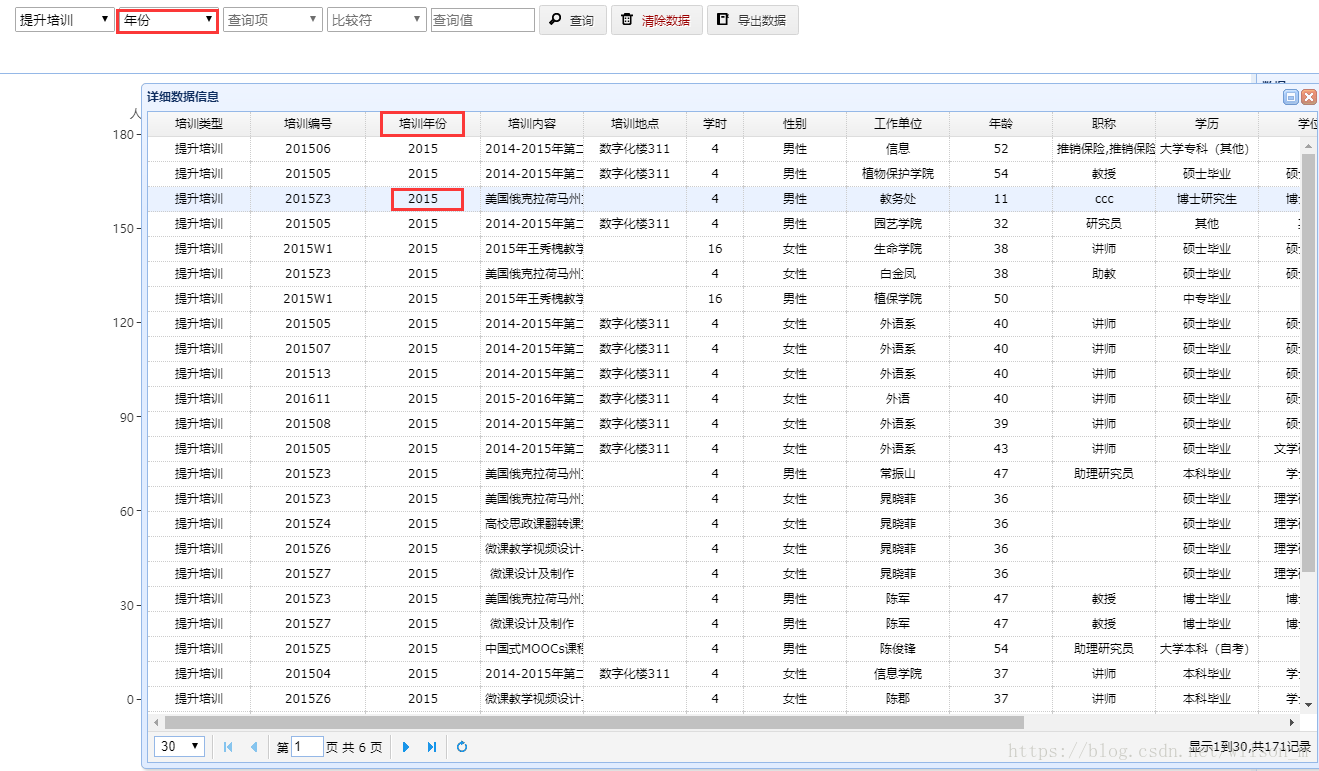
}四、效果演示
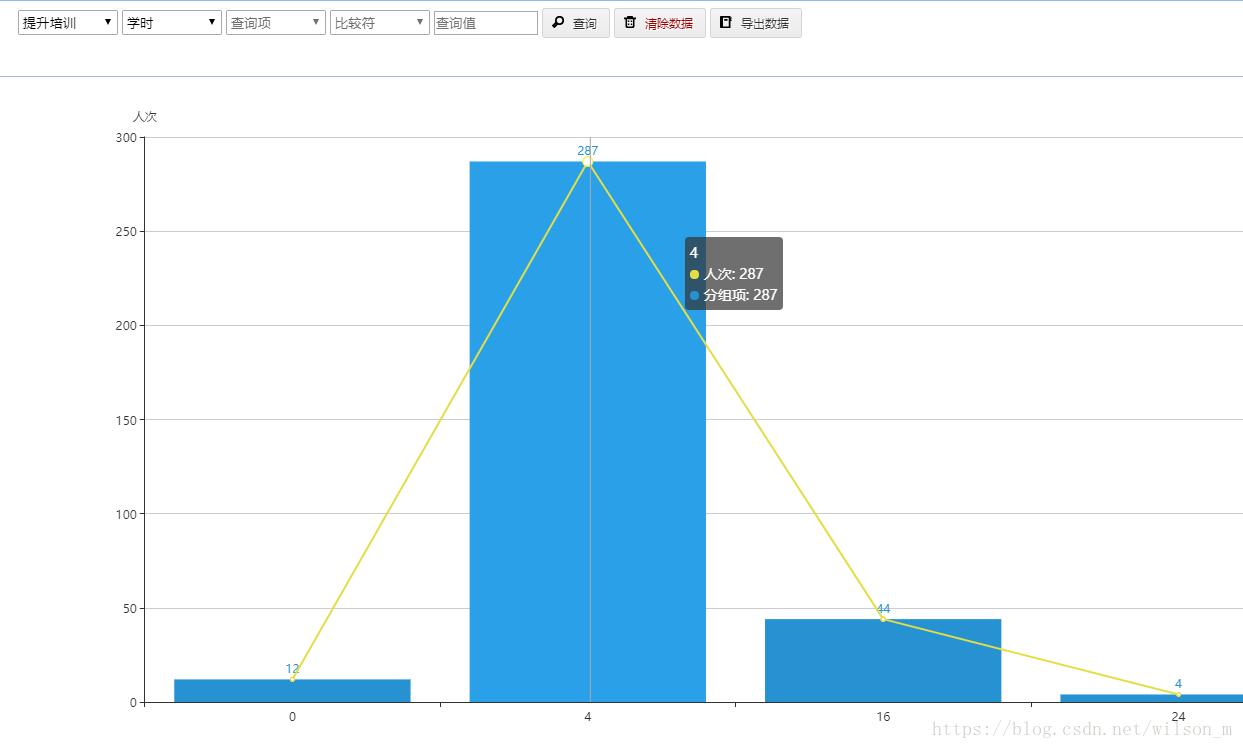
鼠标单击事件: