目录
1. 简介
1-1. jxCell简介
    Jxcell是用于java开发环境的高性能电子表格组件,允许您创建、操作和打印excel工作表。 Excel 97-2013兼容,支持300+ Excel公式(读、写、算)。
    Java Swing组件(超兼容的)支持高级特性,如格式、图像、图表和超链接。 Jxcell完全用纯Java编写,可以兼容任何运行Java 1.5或更高版本的操作系统。
1-2. 同类对比
实现Excel导出功能的主要有 POI, JXL, JXCELL 等工具; 目前只实现了图表的导出的为 JXL 和 JXCELL .
1-2-1. 参照
https://www.cnblogs.com/sicd/p/3895628.html
2. 示例
使用jxcell绘制折线图请参照 https://blog.csdn.net/liujinxin33/article/details/43986911
或者参照 jxcell 的示例, 其demo示例请在 2-1 中的jar下载中查找
2-1. jar准备
jxcell.jar
下载地址: https://download.csdn.net/download/hkk666123/10577079
<dependency>
    <groupId>com.jxcell</groupId>
    <artifactId>jxcell</artifactId>
    <scope>system</scope>
    <version>4.1</version>
    <systemPath>${basedir}\src\lib\jxcell.jar</systemPath>
</dependency>
2-2. 代码
import com.cntv.learn.base.constant.enumdic.FILE_PATH;
import com.jxcell.*;
import com.jxcell.designer.Designer;

import java.awt.*;
import java.io.IOException;

/**
 * @author : LiuDong
 * @description :
 * @date : Created in 2018/7/31 9:32
 */
public class TestChart {
    public static void main(String[] args) throws IOException, CellException {
        typePie();
    }

    /**
     * TODO 测试导出饼图, 饼图的分块颜色无法自定义
     */
    private static void typePie() {
        View m_view = new View();
        RangeRef newRange = null;
        try {
            /** 1.0 数据准备, 可参照./test/TextFormattingTest.java */
            m_view.getLock();
            // 标题 (行,列,值);
            m_view.setTextAsValue(1, 1, "名称");
            m_view.setTextAsValue(1, 2, "数值");
            // 分项
            m_view.setTextAsValue(2, 1, "就诊量");
            m_view.setTextAsValue(3, 1, "取消量");
            m_view.setTextAsValue(4, 1, "爽约量");
            m_view.setTextAsValue(5, 1, "确认预约(待就诊)");
            m_view.setTextAsValue(6, 1, "总计量");
            // 数据
            m_view.setNumber(2, 2, 2182);
            m_view.setNumber(3, 2, 887);
            m_view.setNumber(4, 2, 191);
            m_view.setNumber(5, 2, 142);
            // 序号
            m_view.setTextAsValue(1, 3, "序号");
            m_view.setNumber(2, 3, 1);
            m_view.setNumber(3, 3, 2);
            m_view.setNumber(4, 3, 3);
            m_view.setNumber(5, 3, 4);

            // 设置公式, 可参照./test/formula/FormulaSample.java
            m_view.setFormula(6, 2, "SUM(C3:C6)");
            // 选中单元格区域
            m_view.setSelection("C7:D7");
            // 编辑复制 向右复制
            m_view.editCopyRight();

            /** 1.1 绘制饼图, 可参照./test/chart/ChartFormatDemo.java */
            // 绘图区坐标addChart(左上列x,左上行y,右下列x,右下行y)
            ChartShape chart = m_view.addChart(0, 9, 10, 40);
            // 图表格式, 其他格式参照demo
            chart.setChartType(ChartShape.TypePie);

            // 添加一个系列
            chart.addSeries();
            // 饼图数据源,饼图需要的具体数字,不包含总数,参数为 开始单元格结束单元格
            chart.setSeriesYValueFormula(0, "Sheet1!$C$3:$C$6");
            // 数据对应的说明.如:货车  12辆,这里是货车
            chart.setCategoryFormula("Sheet1!$B$3:$B$6");

            // 图表名称
            chart.setTitle("服务状态分布图");

            /** 1.2 设置样式, 可参照./test/chart/ChartFormatTest.java */
            // 设置列宽行高
            m_view.setColWidth(1, 18 * 256);
            // 设置图纸样式, 参照各种Format类
            ChartFormat cf = chart.getChartFormat();
//            cf.setPattern(com.jxcell.CellFormat.PatternSolid);
//            cf.setPatternFG(m_view.getPaletteEntry(31).getRGB());
            chart.setChartFormat(cf);
            // 设置绘图区颜色
            cf = chart.getPlotFormat();
//            cf.setForeColor((new Color(0, 255, 0)).getRGB());
            chart.setPlotFormat(cf);

            // 展示图饼文字描述
            cf = chart.getSeriesFormat(0);
            cf.setDataLabelPosition(ChartFormat.DataLabelPositionOutside);
//            cf.setDataLabelPosition(ChartFormat.DataLabelPositionAuto);
//            cf.setDataLabelType(ChartFormat.DataLabelValue);
            cf.setDataLabelType(ChartFormat.DataLabelCategoryAndPercent);
            chart.setSeriesFormat(0, cf);

            // 设置图饼分块颜色
            chart.setVaryColors(true);

            cf = chart.getDataLabelFormat(0, 0);
            cf.setForeColor((new Color(0, 0, 255)).getRGB());
            cf.setFontColor((new Color(255, 0, 0)).getRGB());
            chart.setDataLabelFormat(0, 0, cf);

            // 设置标题字体格式
            cf = chart.getTitleFormat();
            cf.setFontBold(true);
            cf.setFontSize(20 * 20);
            chart.setTitleFormat(cf);
            // 图表刻印位置
            chart.setLegendPosition(ChartFormat.LegendPlacementBottom);
            // 图表刻印样式, 取消图饼边框显示
            cf = chart.getLegendFormat();
            cf.setLineNone();
            cf.setFontSizeInPoints(13);
            chart.setLegendFormat(cf);

            /** 2.0 导出功能 */
            // excel写出路径
            m_view.write(FILE_PATH.EXCEL_DOWNLOAD_PATH.getDesc() + "typePieOut0.xls");
            System.out.println("end");
            Designer.newDesigner(m_view);
        } catch (Exception e) {
            System.out.println(e.getMessage());
        } finally {
            m_view.releaseLock();
        }
    }

}
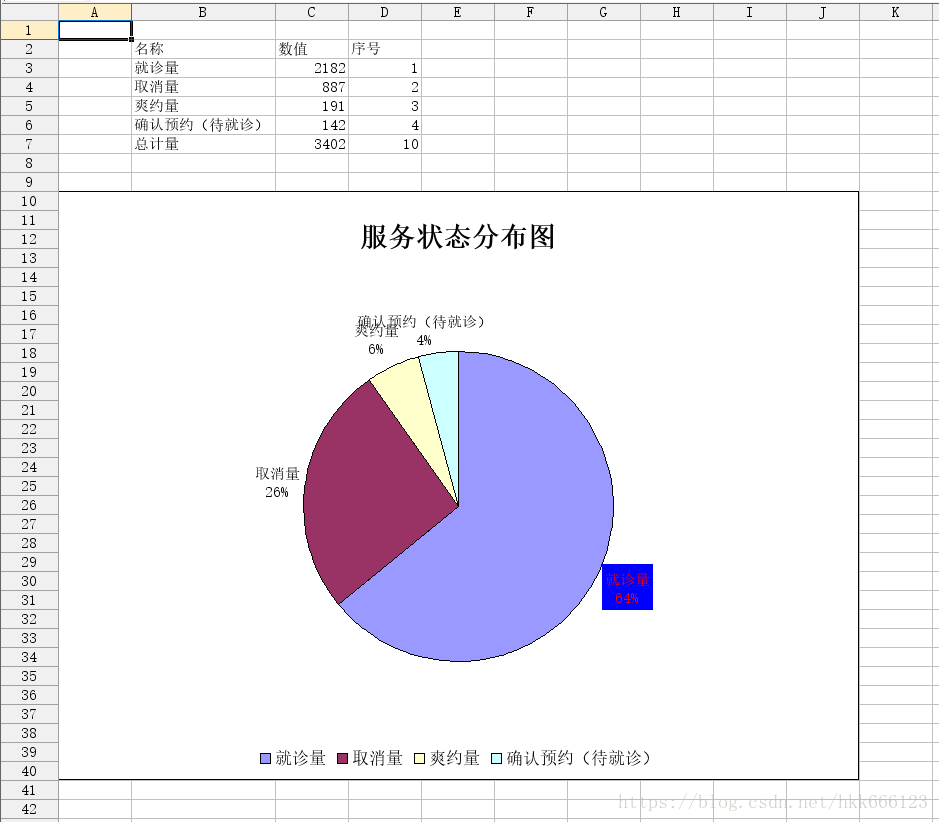
2-3. 执行结果
3. 遗留问题
// 设置饼图分块颜色
chart.setVaryColors(true);
目前只可以通过该方式设置饼图分块的颜色, 无法实现自定义其颜色, 欢迎各位大佬批评指点, 晓得解决方法还望不吝赐教, 先给大佬抱拳了~