Android Studio 3.0 出来了,刚好最近在使用 Android Studio 开发,二话不说,立马升级体验了一把。
Android Studio 升级
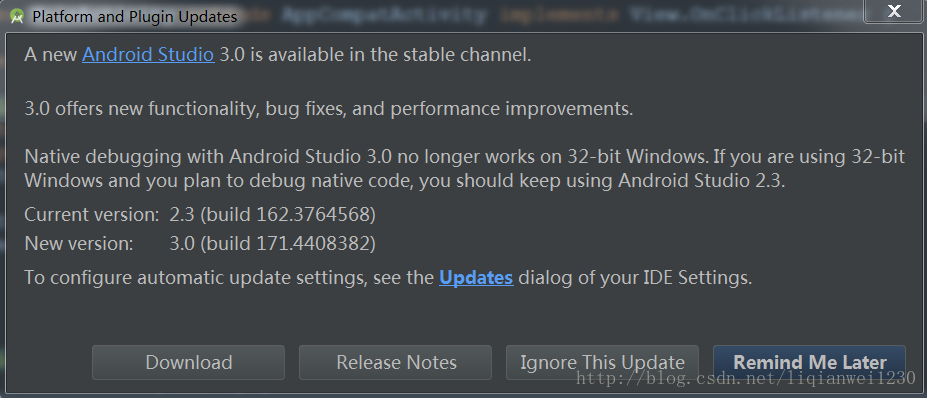
Android Studio 更新很简单,直接 Check for Updates 即可。检查到当前最新版本是 3.0 ,但是由于当前版本和最新版本差别较大不能直接更新,只显示一个 download 按钮让我们跳转到官网下载。Android Studio 官方 Android IDE
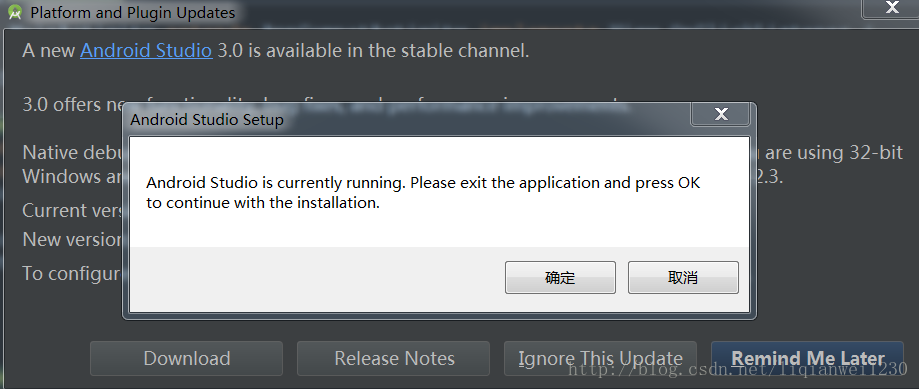
下载完成之后,关闭 ANdroid Studio ,重新安装即可:
Android Studio 3.0 新增的功能
通过官网可以看到本次的更新新增了一些功能:Android Studio Release Notes
1. Android Plugin for Gradle 3.0.0 Gradle 插件版本更新到 3.0.0
2. Kotlin support 支持 Kotlin 语法
3. Java 8 language features support 支持 Java 8 语言功能
4. Android Profiler
5. CPU Profiler
6. Memory Profiler
7. Network Profiler
8. APK profiling and debugging
9. Device File Explorer
10. Instant Apps support
11. Android Things modules
12. Adaptive Icons wizard
13. Support for font resources
14. Firebase App Indexing Assistant
15. Android App Links Assistant
16. Layout Editor
17. Layout Inspector
18. APK Analyzer
19. Google’s Maven repository
Android Profiler
主要用于性能分析,和之前的 Monitor 类似,但功能更加强大了,同时 logcat 从中单独出来作为一个面板查看,显示区域又分为 3 块,分别是 CPU ,内存,网络,实时的显示当前监控的数据。
The new Android Profiler replaces the Android Monitor tool and provides a new suite of tools to measure your app’s CPU, memory, and network usage in realtime. You can perform sample-based method tracing to time your code execution, capture heap dumps, view memory allocations, and inspect the details of network-transmitted files.
To open, click View > Tool Windows > Android Profiler (or click Android Profiler in the toolbar).
The event timeline at the top of the window shows touch events, key presses, and activity changes so you have more context to > understand other performance events in the timeline.
Note: The Logcat view also moved to a separate window (it was previously inside Android Monitor, which was removed).
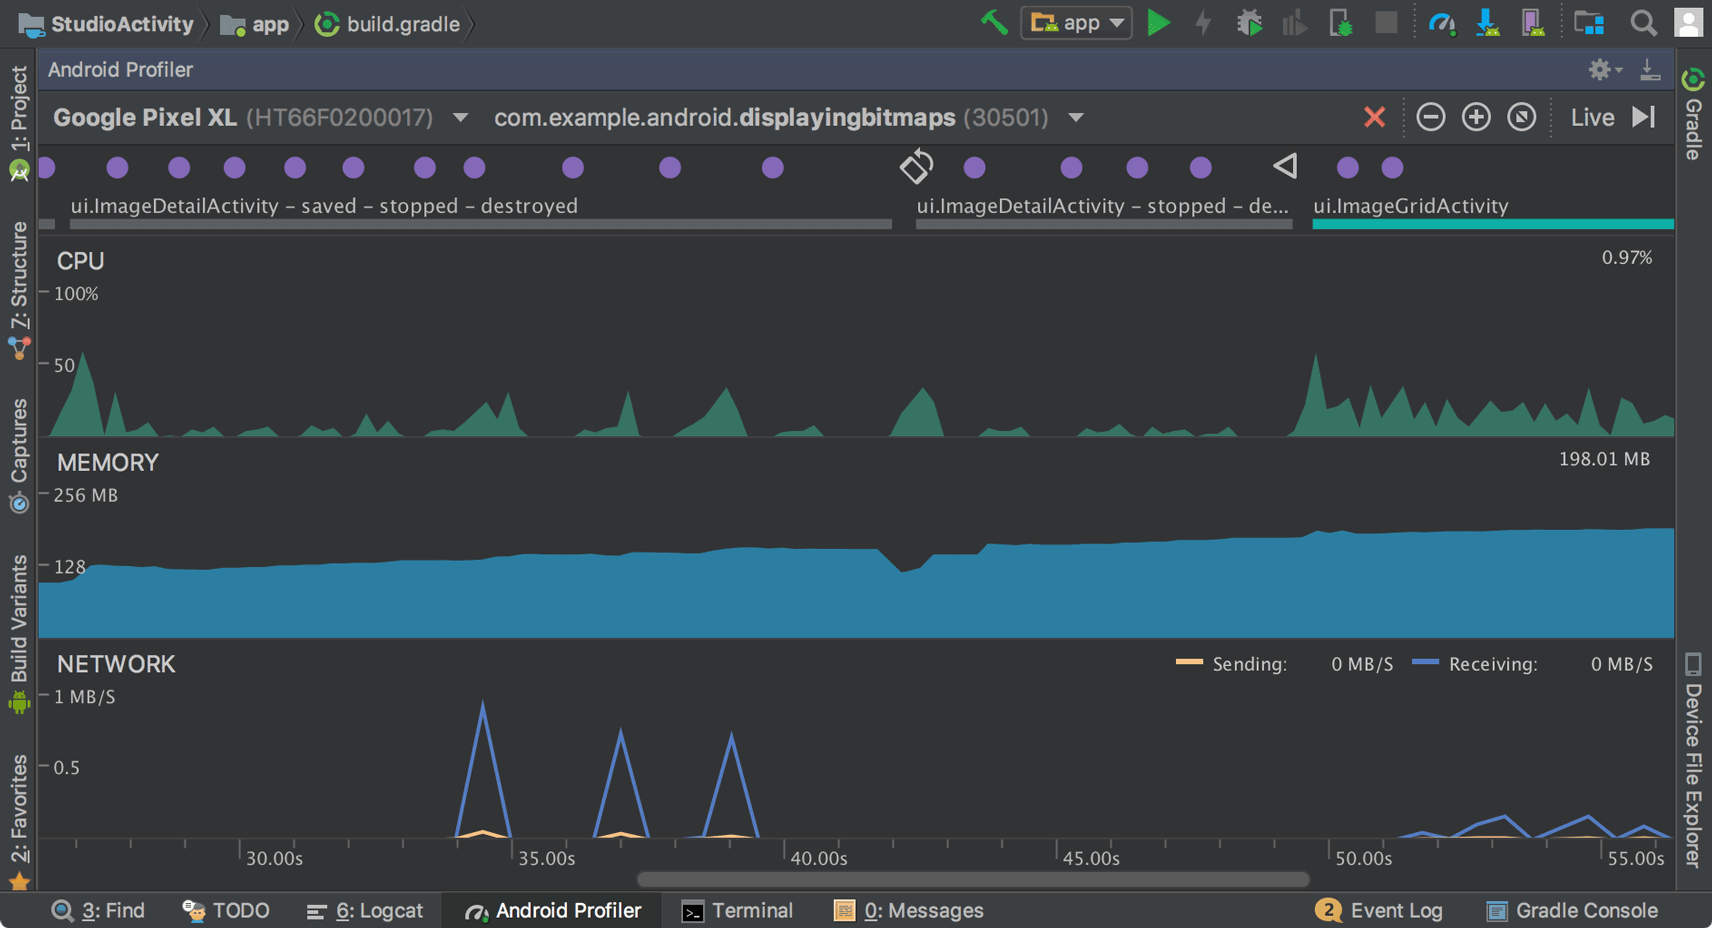
From the Android Profiler’s overview timeline, click on the CPU, MEMORY, or NETWORK timelines to access the corresponding profiler tools.
当我们在显示面板不同区域点击时,则会进入相应的分析面板界面,实例如下:

CPU Profiler
The CPU Profiler helps you analyze the CPU thread usage of your app by triggering a sample or instrumented CPU trace. Then, you can troubleshoot CPU performance issues using a variety of data views and filters.
When you open the CPU profiler, it immediately starts displaying your app’s CPU usage and thread activity. You should see something similar to figure 1.
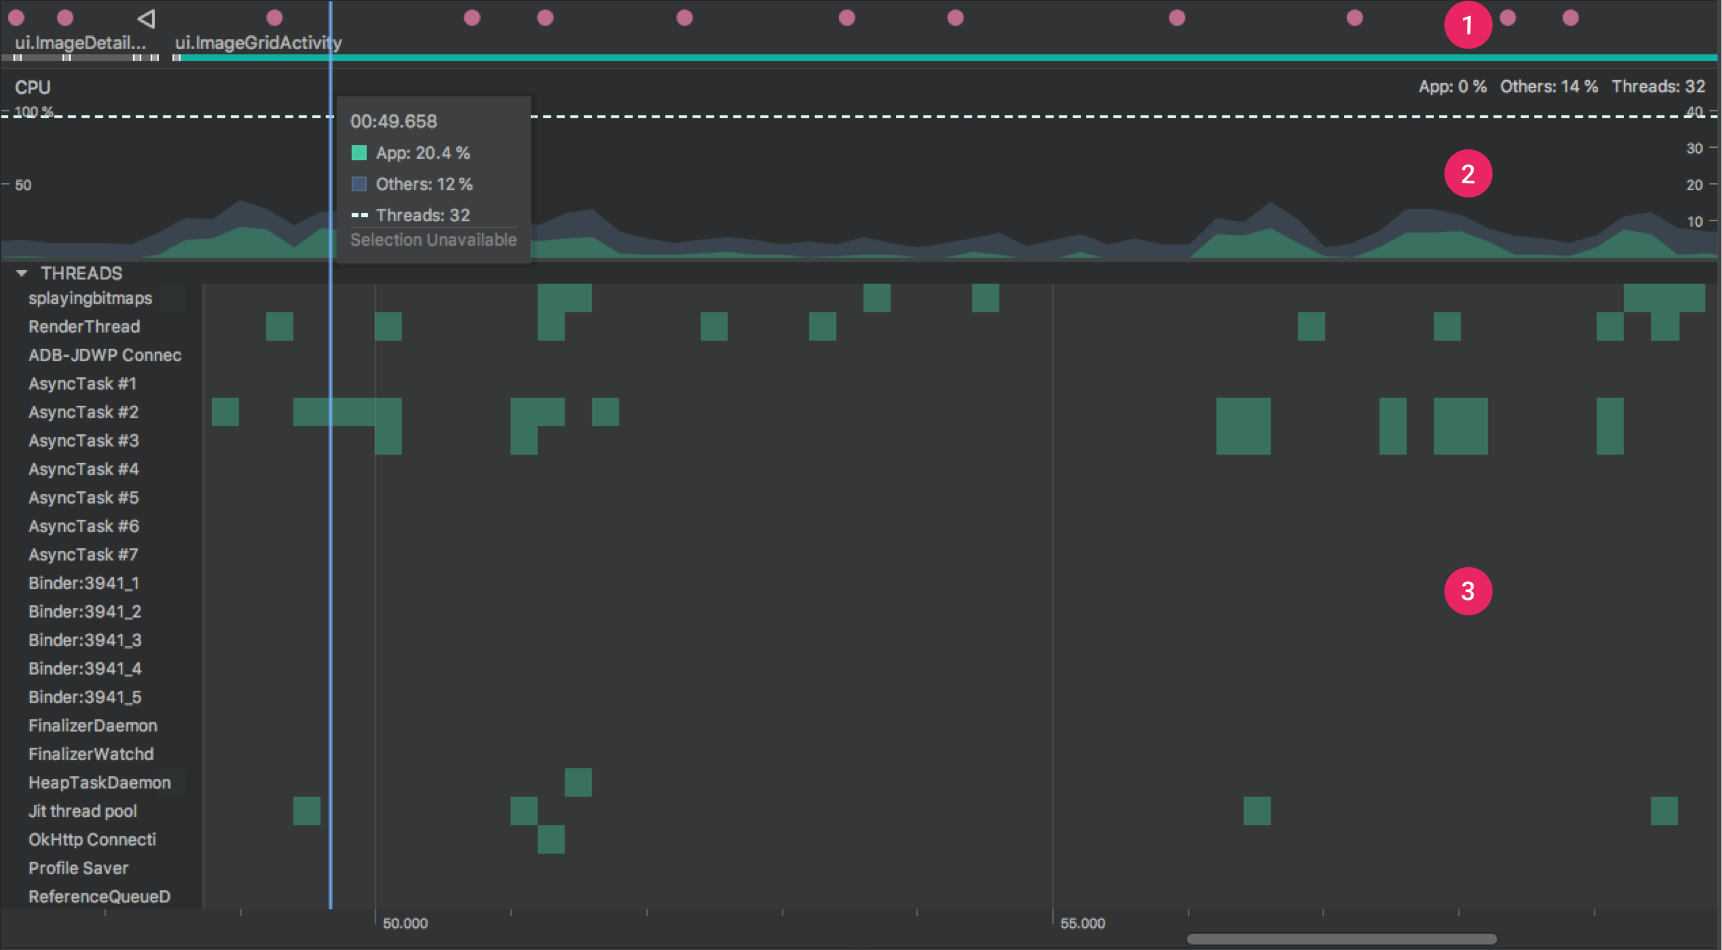
As indicated in figure 1, the default view for the CPU Profiler includes the following:
1 Event timeline: Shows the activities in your app as they transition through different states in their lifecycle, and indicates user interactions with the device, including screen rotation events. To learn more about the event timeline, including how to enable it, read Enable advanced profiling.
2 CPU timeline: Shows real-time CPU usage of your app—as a percentage of total available CPU time—and the total number of threads your app is using. The timeline also shows the CPU usage of other processes (such as system processes or other apps), so you can compare it to your app’s usage. You can inspect historical CPU usage data by moving your mouse along the horizontal axis of the timeline.
3 Thread activity timeline: Lists each thread that belongs to your app process and indicates their activity along a timeline using the colors listed below. After you record a method trace, you can select a thread from this timeline to inspect its data in the trace pane.
Green: The thread is active or is ready to use the CPU. That is, it’s in a ‘running’ or ‘runnable’ state.
Yellow: The thread is active, but it’s waiting on an I/O operation, such as disk or network I/O, before it can complete its work.
Gray: The thread is sleeping and is not consuming any CPU time. This sometimes occurs when the thread requires access to a resource that is not yet available. Either the thread goes into voluntary sleep, or the kernal puts the thread to sleep until the required resource becomes available.
4 Recording configurations: Allows you to select one of the following options to determine how the profiler records a method trace.
Sampled: A default configuration that captures your app’s call stack at frequent intervals during your app’s execution. The profiler compares sets of captured data to derive timing and resource usage information about your app’s code execution. An inherent issue of sampled-based tracing is that if your app enters a method after a capture of the call stack and exits the method before the next capture, that method call is not logged by the profiler. If you are interested in tracing methods with such short lifecycles, you should use instrumented tracing.
Instrumented: A default configuration that instruments your app at runtime to record a timestamp at the beginning and end of each method call. Timestamps are collected and compared to generate method tracing data, including timing information and CPU usage. Note that the overhead associated with instrumenting each method impacts runtime performance and may influence profiling data—this is even more noticeable for methods with relatively short lifecycles. Additionally, if your app executes a large number of methods in short amount of time, the profiler may quickly exceed its file size limit and not be able to record any further tracing data.
Edit configurations: Allows you to change certain defaults of the sampled and instrumented recording configurations described above, and save them as a custom configuration. To learn more, go to the section about creating recording configurations.
5 Record button: Starts and stops recording a method trace. To learn more, go to the section about recording and inspecting method traces.
Note: The profiler also reports CPU usage of threads that Android Studio and the Android platform add to your app process—such as JDWP, Profile Saver, Studio:VMStats, Studio:Perfa, and Studio:Heartbeat (although, the exact names displayed in the thread activity timeline may vary). This means your app’s CPU usage in the CPU timeline also reports CPU time used by these threads. You can see some of these threads in the thread activity timeline and also monitor their activity. (However, because the profiler threads execute native code, you can’t record method tracing data for them.) Android Studio reports this data so you can easily identify when thread activity and CPU usage is actually caused by your app’s code.
Record and inspect method traces
To start recording a method trace, select either the Sampled or Instrumented recording configuration, or a custom recording configuration you’ve created, from the dropdown menu and click Record . Interact with your app and click Stop recording when you’re done. The profiler automatically selects the recorded time frame and displays its tracing information in the method trace pane, as shown in figure 2. If you want to inspect the method trace for a different thread, just select it from the thread activity timeline.
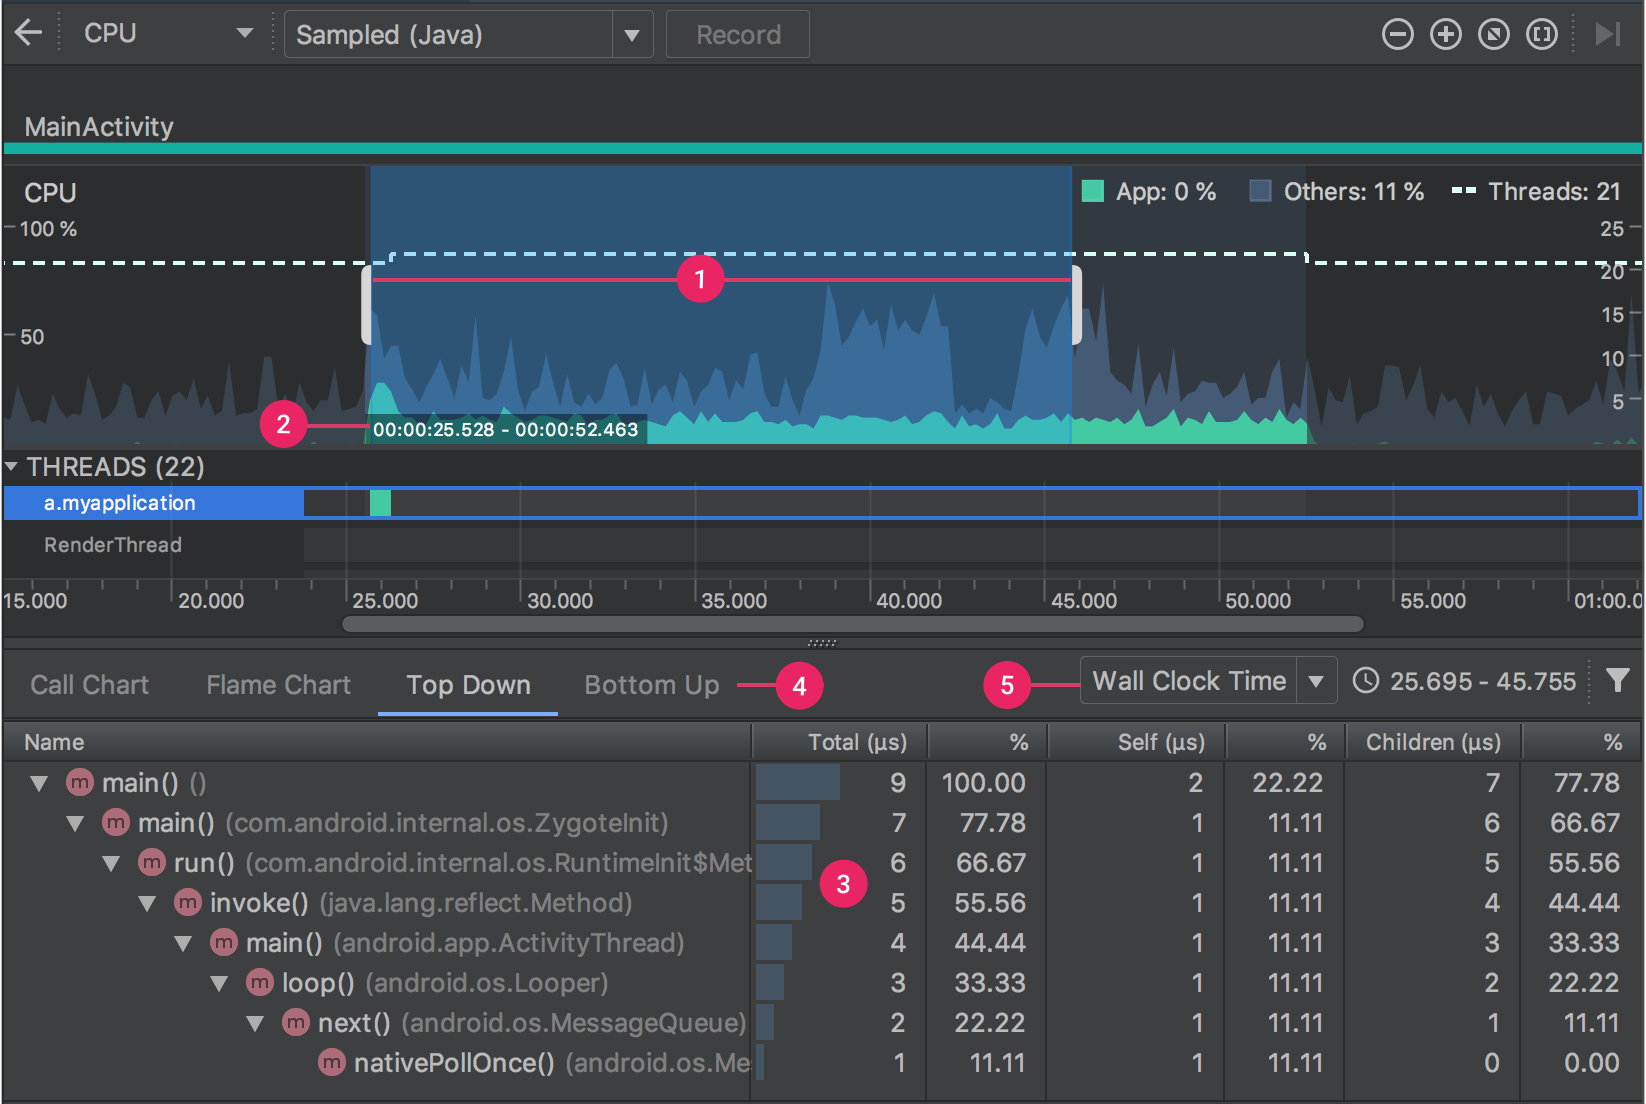
1 Selected time frame: Determines the portion of the recorded time frame you want to inspect in the trace pane. When you first record a method trace, the CPU profiler automatically selects the entire length of your recording in the CPU timeline. If you want to inspect method trace data for only a portion of the recorded time frame, you can click and drag the edges of the highlighted region to modify its length.
2 Timestamp: Indicates the start and end time of a recorded method trace (relative to when the profiler started collecting CPU usage information from your device). You can click the timestamp to automatically select the entire recording as your selected time frame—this is particularly useful if you have multiple recordings you want to switch between.
3 Trace pane: Displays method trace data for the time frame and thread you’ve selected. This pane appears only after you record at least one method trace. In this pane, you can select how you want to view each stack trace (using the trace tabs) and how you want to measure execution time (using the time reference drop down menu).
4 Choose to display your method trace as a Top Down tree, Bottom Up tree, Call Chart, or Flame Chart. You can learn more about each of the trace pane tabs in the sections below.
5 Select one of the following options from the dropdown menu to determine how timing information for each method call is measured:
Wall clock time: timing information represents actual elapsed time.
Thread time: timing information represents actual elapsed time minus any portion of that time where the thread is not consuming CPU resources. For any given method, its thread time is always less than or equal to its wall clock time. Using thread time gives you a better understanding of how much of a thread’s actual CPU usage is consumed by a given method.
Memory Profiler
The Memory Profiler helps you identify memory leaks and memory churn that can lead to stutter, freezes, and even app crashes. It shows a realtime graph of your app’s memory use, lets you capture a heap dump, force garbage collections, and track memory allocations.
Memory Profiler overview
When you first open the Memory Profiler, you’ll see a detailed timeline of your app’s memory use and access tools to force garbage collection, capture a heap dump, and record memory allocations.
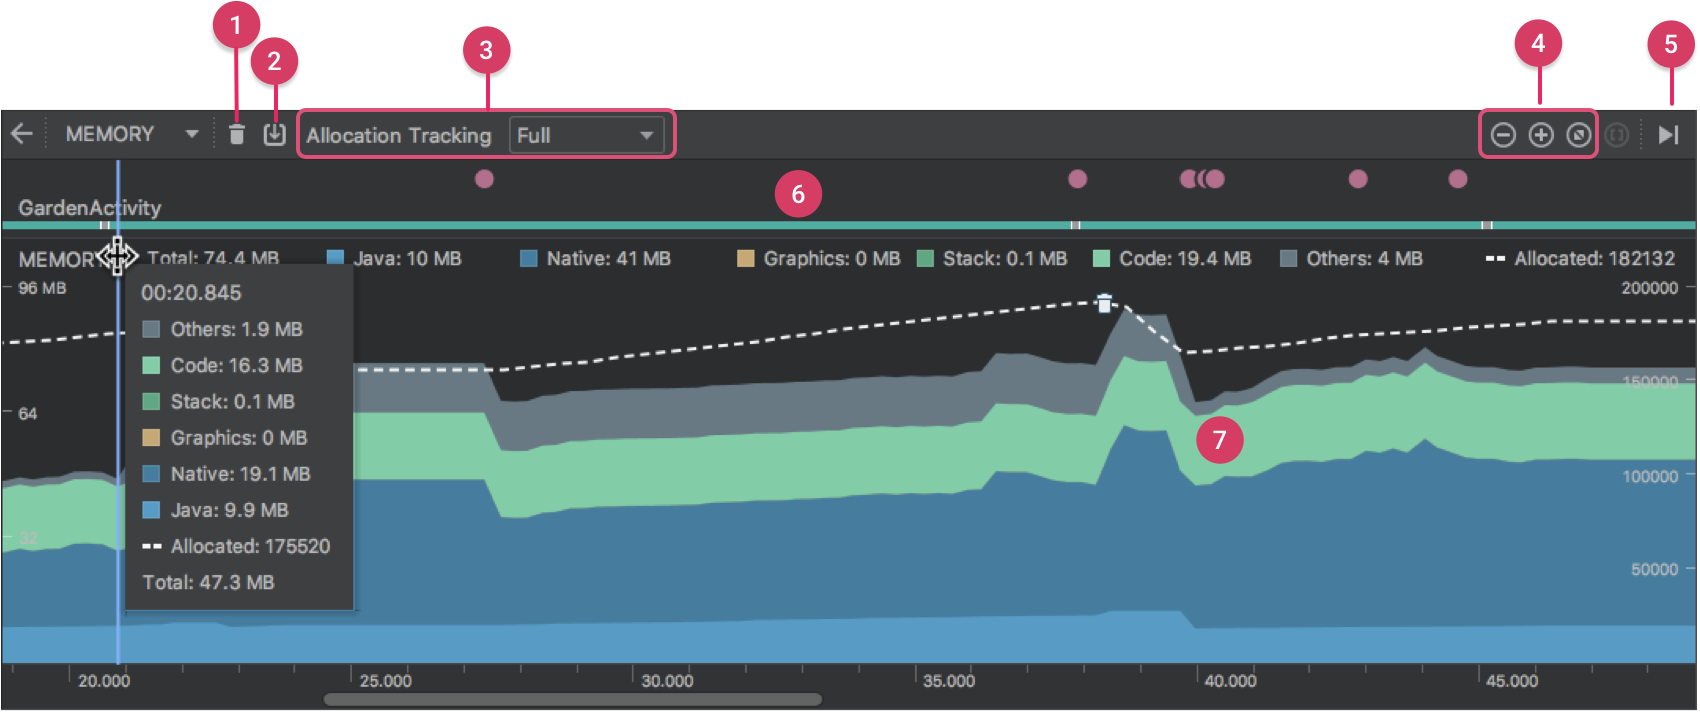
As indicated in figure 1, the default view for the Memory Profiler includes the following:
1 A button to force a garbage collection event.
2 A button to capture a heap dump.
3 A button to record memory allocations. This button appears only when connected to a device running Android 7.1 or lower.
4 Buttons to zoom in/out of the timeline.
5 A button to jump forward to the live memory data.
6 The event timeline, which shows the activity states, user input events, and screen rotation events.
7 The memory use timeline, which includes the following:
- A stacked graph of how much memory is being used by each memory category, as indicated by the y-axis on the left and the color key at the top.
- A dashed line indicates the number of allocated objects, as indicated by the y-axis on the right.
- An icon for each garbage collection event.
However, if you’re using a device running Android 7.1 or lower, not all profiling data is visible by default. If you see a message that says, “Advanced profiling is unavailable for the selected process,” you need to enable advanced profiling to see the following:
- Event timeline
- Number of allocated objects
- Garbage collection events
On Android 8.0 and higher, advanced profiling is always enabled for debuggable apps.
How memory is counted
The numbers you see at the top of the Memory Profiler (figure 2) are based on all the private memory pages that your app has committed, according to the Android system. This count does not include pages shared with the system or other apps.

The categories in the memory count are as follows:
1.Java: Memory from objects allocated from Java or Kotlin code.
2.Native: Memory from objects allocated from C or C++ code.
Even if you’re not using C++ in your app, you might see some native memory used here because the Android framework uses native memory to handle various tasks on your behalf, such as when handling image assets and other graphics—even though the code you’ve written is in Java or Kotlin.
3.Graphics: Memory used for graphics buffer queues to display pixels to the screen, including GL surfaces, GL textures, and so on. (Note that this is memory shared with the CPU, not dedicated GPU memory.)
4.Stack: Memory used by both native and Java stacks in your app. This usually relates to how many threads your app is running.
5.Code: Memory that your app uses for code and resources, such as dex bytecode, optimized or compiled dex code, .so libraries, and fonts.
6.Other: Memory used by your app that the system isn’t sure how to categorize.
7.Allocated: The number of Java/Kotlin objects allocated by your app. This does not count objects allocated in C or C++.
When connected to a device running Android 7.1 and lower, this allocation count starts only at the time the Memory Profiler connected to your running app. So any objects allocated before you start profiling are not accounted for. However, Android 8.0 includes an on-device profiling tool that keeps track of all allocations, so this number always represents the total number of Java objects outstanding in your app on Android 8.0 and higher.
When compared to memory counts from the previous Android Monitor tool, the new Memory Profiler records your memory differently, so it might seem like your memory use is now higher. The Memory Profiler monitors some extra categories that increase the total, but if you only care about the Java heap memory, then the “Java” number should be similar to the value from the previous tool.
And although the Java number probably doesn’t exactly match what you saw in Android Monitor, the new number accounts for all physical memory pages that have been allocated to your app’s Java heap since it was forked from Zygote. So this provides an accurate representation of how much physical memory your app is actually using.
Note: Currently, the Memory Profiler also shows some false-positive native memory usage in your app that actually belongs to the profiling tools. Up to 10MB of memory is added for ~100k objects. In a future version of the tools, these numbers will be filtered out
View memory allocations
Memory allocations show you how each object in your memory was allocated. Specifically, the Memory Profiler can show you the following about object allocations:
- What type of objects were allocated and how much space they use.
- The stack trace of each allocation, including in which thread.
- When the objects were deallocated (only when using a device with Android 8.0 or higher).
If your device is running Android 8.0 or higher, you can view your object allocations at any time as follows: Just click-and-hold in the timeline and drag to select the region where you want to view the allocations (as shown in video 1). There’s no need to begin a recording session because Android 8.0 and higher includes an on-device profiling tool that constantly tracks your app’s allocations.
If your device is running Android 7.1 or lower, click Record memory allocations  in the Memory Profiler toolbar. While recording, Android Monitor tracks all allocations that occur in your app. When you’re done, click Stop recording
  (the same button; see video 2) to view the allocations.
因为图片大小的闲置,这里截取了 4 段视频
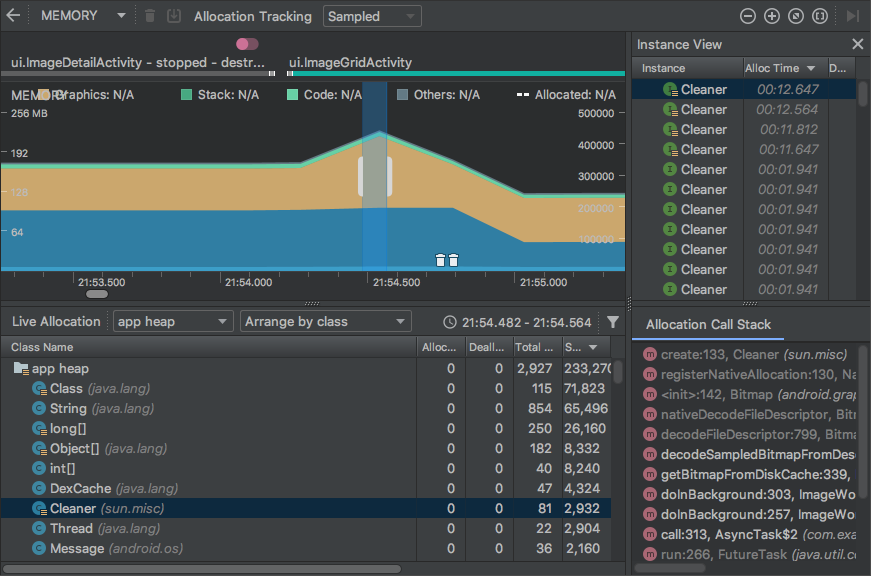
Once you select a region of the timeline (or when you finish a recording session with a device running Android 7.1 or lower), the list of allocated objects appears below the timeline, grouped by class name and sorted by their heap count.
Note: On Android 7.1 and lower, you can record a maximum of 65535 allocations. If your recording session exceeds this limit, only the most recent 65535 allocations are saved in the record. (There is no practical limit on Android 8.0 and higher.)
To inspect the allocation record, follow these steps:
Browse the list to find objects that have unusually large heap counts and that might be leaked. To help find known classes, click the Class Name column header to sort alphabetically. Then click a class name. The Instance View pane appears on the right, showing each instance of that class, as shown in figure 3.
In the Instance View pane, click an instance. The Call Stack tab appears below, showing where that instance was allocated and in which thread.
In the Call Stack tab, click on any line to jump to that code in the editor.
By default, the list of allocations on the left is arranged by class name. At the top of the list, you can use the drop-down on the right to switch between the following arrangements:
- Arrange by class: Groups all allocations based on class name.
- Arrange by package: Groups all allocations based on package name.
- Arrange by callstack: Groups all allocations into their corresponding call stack.
Capture a heap dump
A heap dump shows which objects in your app are using memory at the time you capture the heap dump. Especially after an extended user session, a heap dump can help identify memory leaks by showing objects still in memory that you believe should no longer be there. Once you capture a heap dump, you can view the following:
- What types of objects your app has allocated, and how many of each.
- How much memory each object is using.
- Where references to each object are being held in your code.
- The call stack for where an object was allocated. (Call stacks are currently available with a heap dump only with Android 7.1 and lower when you capture the heap dump while recording allocations.)
To capture a heap dump, click Dump Java heap in the Memory Profiler toolbar . While dumping the heap, the amount of Java memory might increase temporarily. This is normal because the heap dump occurs in the same process as your app and requires some memory to collect the data.
The heap dump appears below the memory timeline, showing all class types in the heap, as shown in figure 4.
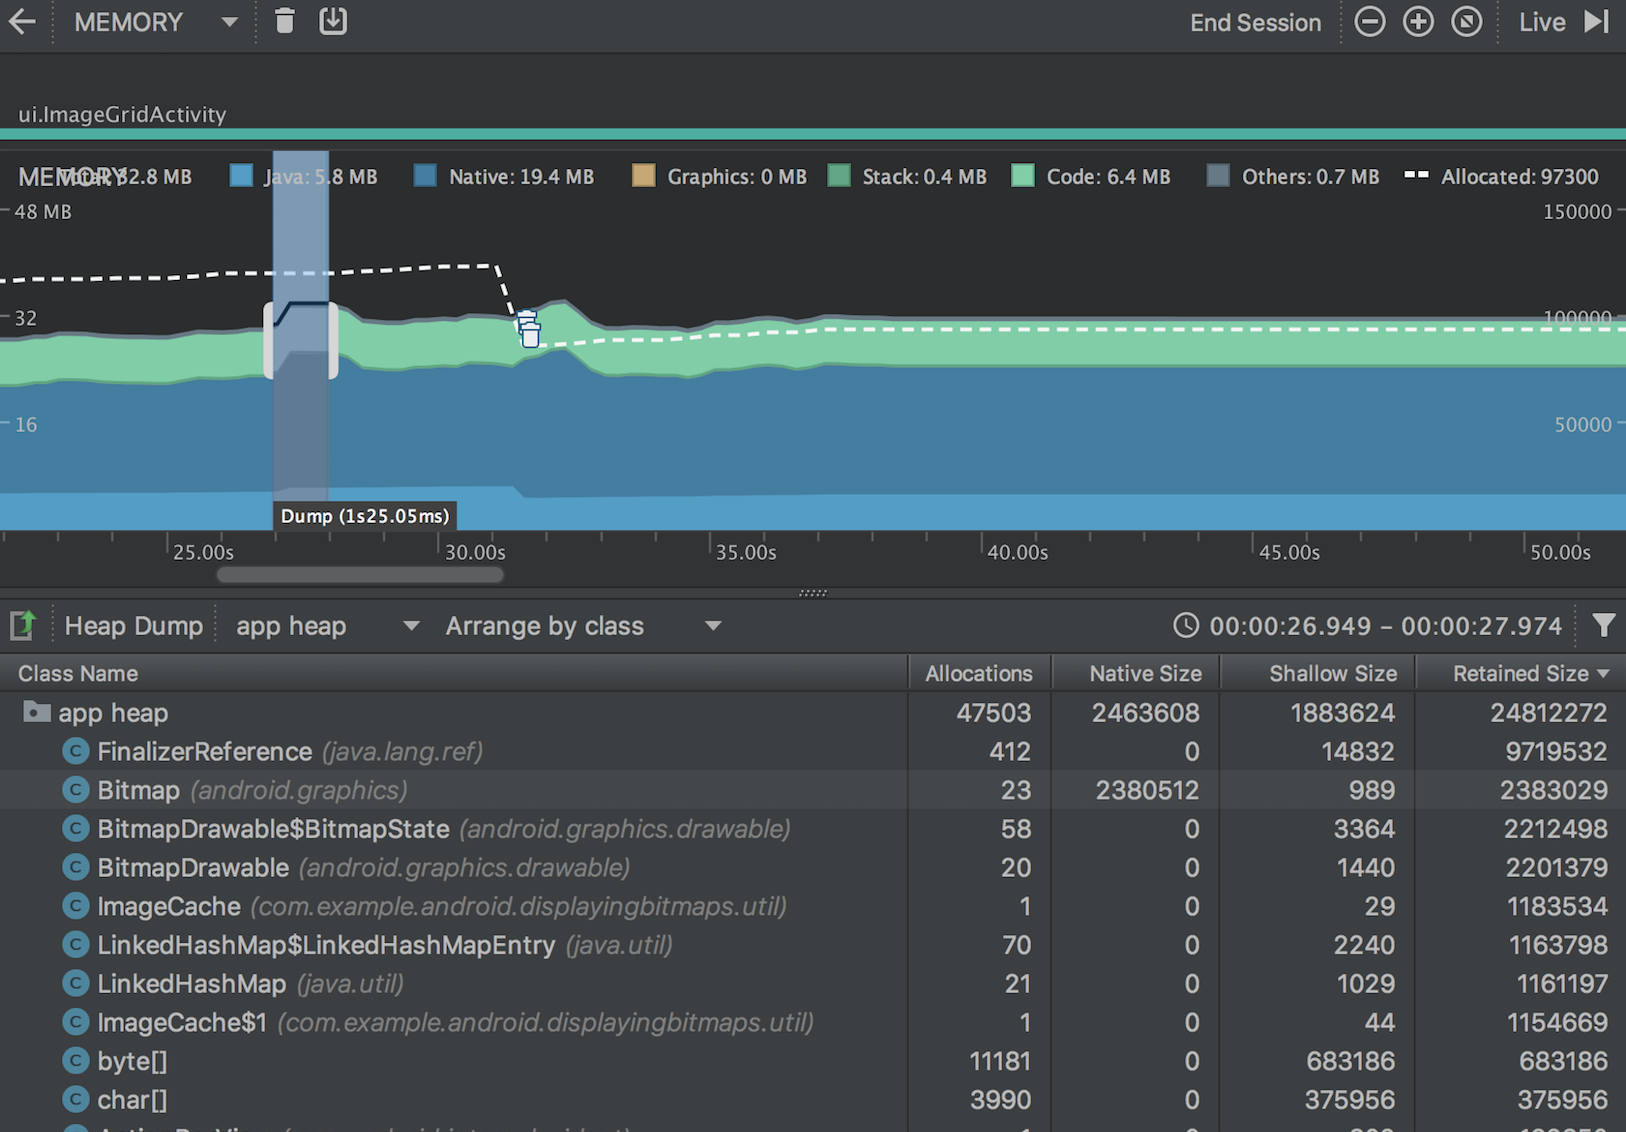
If you need to be more precise about when the dump is created, you can create a heap dump at the critical point in your app code by calling dumpHprofData().
In the list of classes, you can see the following information:
Alloc Count: Number of allocations in the heap.
Native Size: Total amount of native memory used by this object type (in bytes). This column is visible only for Android 7.0 and higher.
You will see memory here for some objects allocated in Java because Android uses native memory for some framework classes, such as Bitmap.Shallow Size: Total amount of Java memory used by this object type (in bytes).
Retained Size: Total size of memory being retained due to all instances of this class (in bytes).
At the top of the class list, you can use the left drop-down list to switch between the following heap dumps:Default heap: When no heap is specified by the system.
App heap: The primary heap on which your app allocates memory.
Image heap: The system boot image, containing classes that are preloaded during boot time. Allocations here are guaranteed to never move or go away.
Zygote heap: The copy-on-write heap where an app process is forked from in the Android system.
The list of objects in the heap are arranged by class name, by default. You can use the other drop-down to switch between the following arrangements:Arrange by class: Groups all allocations based on class name.
Arrange by package: Groups all allocations based on package name.
Arrange by callstack: Groups all allocations into their corresponding call stack. This option works only if you capture the heap dump while recording allocations. Even so, there are likely to be objects in the heap that were allocated before you started recording, so those allocations appear first, simply listed by class name.
The list is sorted by the Retained Size column, by default. You can click on any of the column headers to change how the list is sorted.
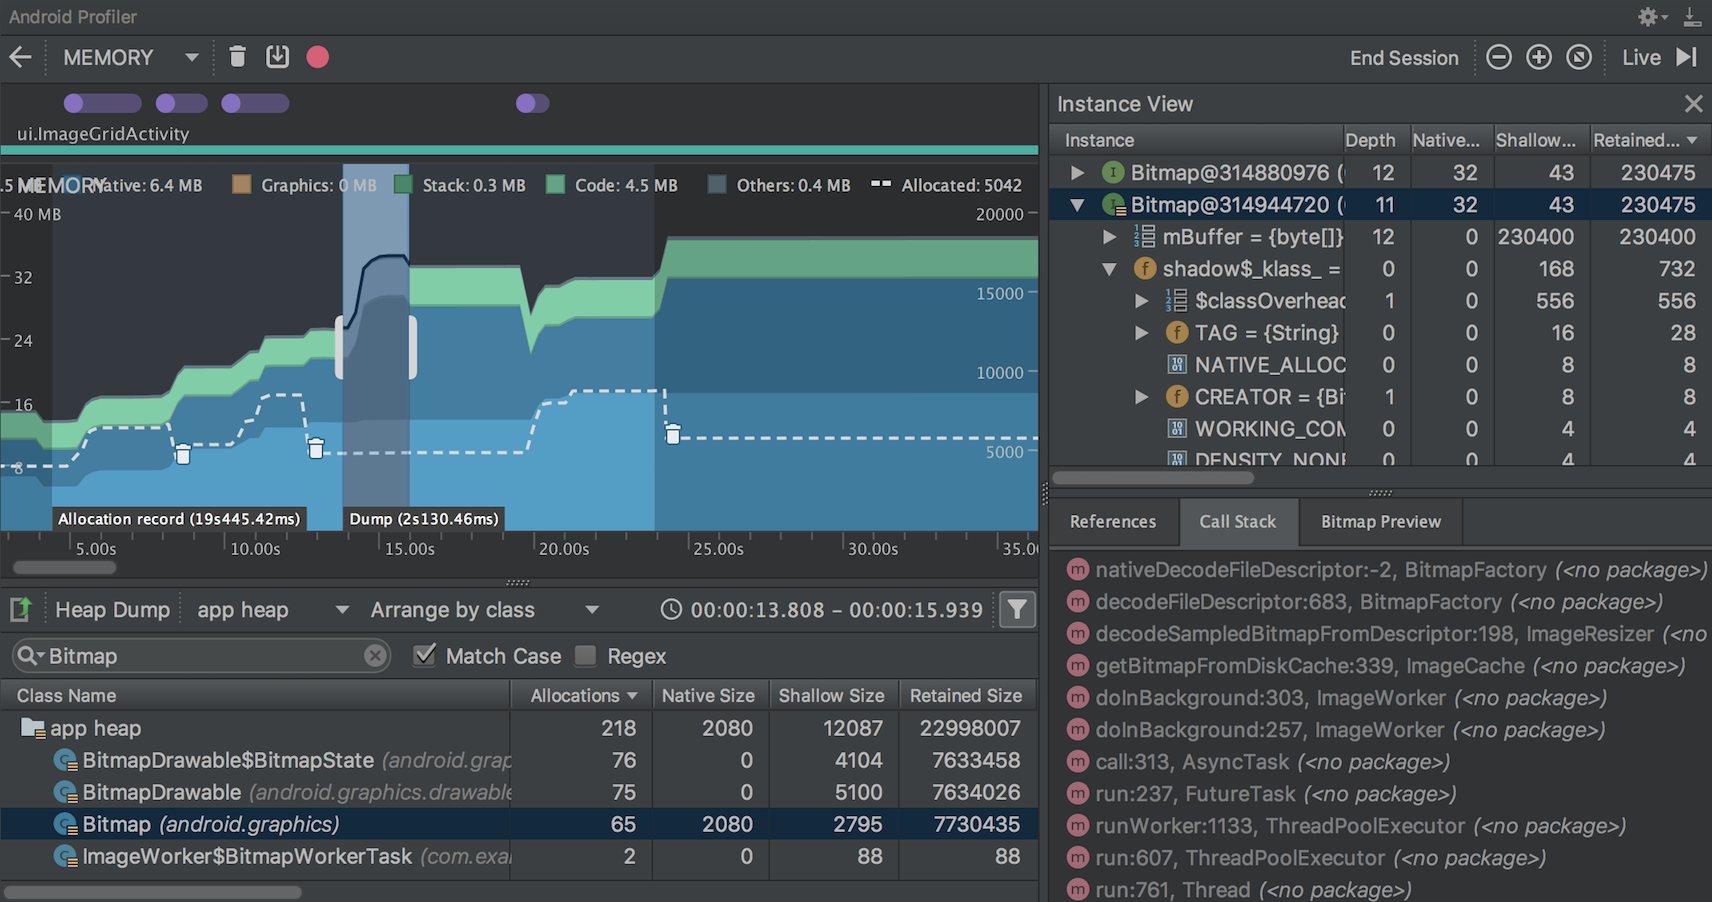
Click a class name to open the Instance View window on the right (shown in figure 5). Each listed instance includes the following:
Depth: The shortest number of hops from any GC root to the selected instance.
Native Size: Size of this instance in native memory. This column is visible only for Android 7.0 and higher.
Shallow Size: Size of this instance in Java memory.
Retained Size: Size of memory that this instance dominates (as per the dominator tree).
Note: By default, the heap dump does not show you the stack trace for each allocated object. To get the stack trace, you must begin recording memory allocations before you click Dump Java heap. Then, you can select an instance in the Instance View and see the Call Stack tab alongside the References tab, as shown in figure 5. However, it’s likely that some objects were allocated before you began recording allocations, so the call stack is not available for those objects. Instances that do include a call stack are indicated with a “stack” badge on the icon . (Unfortunately, because the stack trace requires that you perform allocation recording, you currently cannot see the stack trace for heap dumps on Android 8.0.)
To inspect your heap, follow these steps:
Browse the list to find objects that have unusually large heap counts and that might be leaked. To help find known classes, click the Class Name column header to sort alphabetically. Then click a class name. The Instance View pane appears on the right, showing each instance of that class, as shown in figure 5.
n the Instance View pane, click an instance. The References tab appears below, showing every reference to that object.
Or, click the arrow next to the instance name to view all its fields, and then click a field name to view all its references. And if you want to view the instance details for a field, right-click on the field and select Go to Instance.In the References tab, if you identify a reference that might be leaking memory, right-click on it and select Go to Instance. This selects the corresponding instance from the heap dump, showing you its own instance data.
In your heap dump, look for memory leaks caused by any of the following:
Long-lived references to Activity, Context, View, Drawable, and other
objects that might hold a reference to the Activity or Context container.Non-static inner classes, such as a Runnable, that can hold an Activity instance.
Caches that hold objects longer than necessary.
Save the heap dump as HPROF
Once you capture a heap dump, the data is viewable in the Memory Profiler only while the profiler is running. When you exit the profiling session, you lose the heap dump. So if you want to save it for review later, export the heap dump to an HPROF file by clicking Export capture to file , in the toolbar below the timeline. In the dialog that appears, be sure to save the file with the .hprof suffix.
You can then reopen the file in Android Studio by dragging the file into an empty editor window (or drop it in the file tab bar).
To use a different HPROF analyzer like jhat you need to convert the HPROF file from Android format to the Java SE HPROF format. You can do so with the hprof-conv tool provided in the android_sdk/platform-tools/ directory. Run the hprof-conv command with two arguments: the original HPROF file and the location to write the converted HPROF file. For example:
hprof-conv heap-original.hprof heap-converted.hprofNetwork Profiler
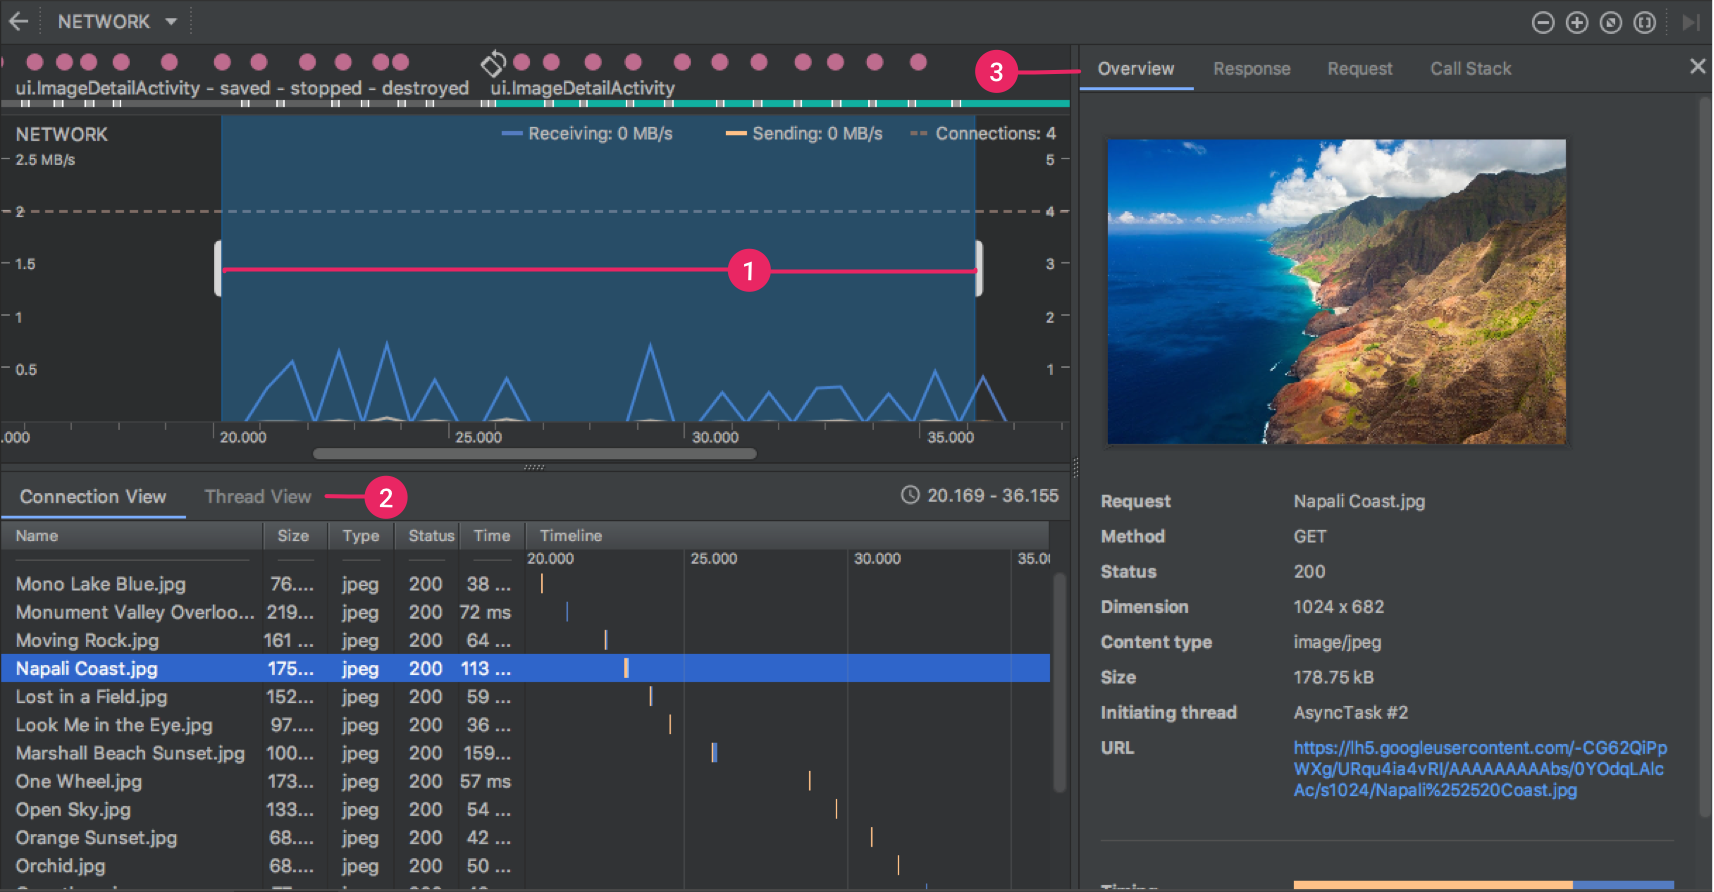
The Network Profiler allows you to monitor the network activity of your app, inspect the payload of each of your network requests, and link back to the code that generated the network request.
At the top of the window, you can see the event timeline and 1 radio power state (high/low) vs Wi-Fi. On the timeline, you can 2 click and drag to select a portion of the timeline to inspect the traffic. The 3 window below then shows files sent and received during the selected portion of the timeline, including file name, size, type, status, and time. You can sort this list by clicking any of the column headers. You also see a detailed breakdown of the selected portion of the timeline, showing when each file was sent or received.
Click a connection’s name to view 4 detailed information about a selected file sent or received. Click the tabs to view the response data, header information, or the call stack.
Device File Explorer
设备的文件管理器也是新增的一个面板,不再需要打开 DDMS 进去再查看设备的文件管理。
The new Device File Explorer allows you to inspect your connected device’s filesystem, and transfer files between the device and your computer. This replaces the filesystem tool available in DDMS.
To open, click View > Tool Windows > Device File Explorer.
View On-Device Files with Device File Explorer
The Device File Explorer allows you to view, copy, and delete files on an Android device. This is useful when examining files that are created by your app or if you want to transfer files to and from a device.
Note: Most device data is not visible unless you are using a rooted device or an emulator with a standard Android (AOSP) system image (not one of the Google APIs or Google Play system images). And when using a connected device, be sure you enable USB debugging.
To work with a device’s file system, proceed as follows:
1 Click View > Tool Windows > Device File Explorer or click the Device File Explorer button in the tool window bar to open the Device File Explorer.
2 elect a device from the drop down list.
3 Interact with the device content in the file explorer window. Right-click on a file or directory to create a new file or directory, save the selected file or directory to your machine, upload, delete, or synchronize. Double-click a file to open it in Android Studio.
Android Studio saves files you open this way in a temporary directory outside of your project. If you make modifications to a file you opened using the Device File Explorer, and would like to save your changes back to the device, you must manually upload the modified version of the file to the device.

When exploring a device’s files, the following directories are particularly useful:
data/data/app_name/
Contains data files for your app stored on internal storage
sdcard/
Contains user files stored on external user storage (pictures, etc.)
Note: Not all files on a hardware device are visible in the Device File Explorer. For example, in the data/data/ directory, entries corresponding to apps on the device that are not debuggable cannot be expanded in the Device File Explorer.
总结
这次的 Android Studio 更新实在是太给力了,这次虽然只是初步的体验了一下,就让人有种挫败又兴奋的感觉,挫败是因为英语水平实在是有限不能第一手体验;兴奋则是因为刚开始玩 AS ,就赶上了更新,不至于一开始就落后太多,而是站在了巨人的肩膀之上,心里不至于有太多的落差。
happy a nice day!