前言:接触这么久的前端,还没有真正的和后端交互过,今天正式接触前后端交互,这里使用axios,由于使用的是vue框架,据说vue2.0版本之前使用的是vue-resource,但是已经不在维护了,目前主流的vue项目,用的都是axios来完成ajax请求,所以这里主要介绍一下目前的交互情况与细节
一、使用npm安装axios,首先要安装node不用说了
Npm install axios -S二、安装之后创建一个api文件夹,再创建indexJS文件,里面设置请求接口首先要引入axios
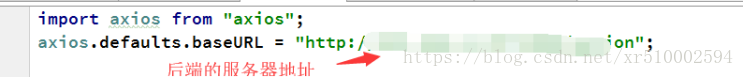
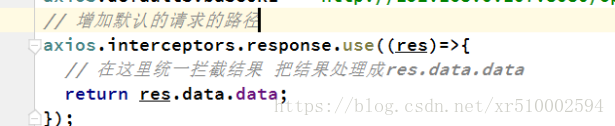
在这里下面两句话,通过设置来方便之后的请求,不然后面的请求数据就是data.data.data..这样直接一个data就可以搞定,也保证了代码的美观。
这里是对应的模块接口,get方法获取地址。


三、在配置完之后,在组件中 import 引入
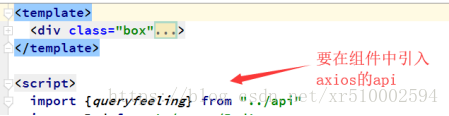

在这里,要配置axios,下方代码已经详解了。

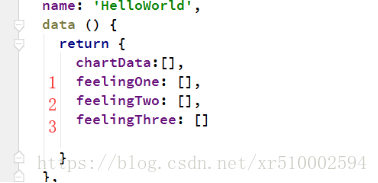
另外,由于value值有三个,并且不能直接在value值中直接渲染数据,要在data中先设置变量,然后上面的步骤获取到data对应的值,就OK了
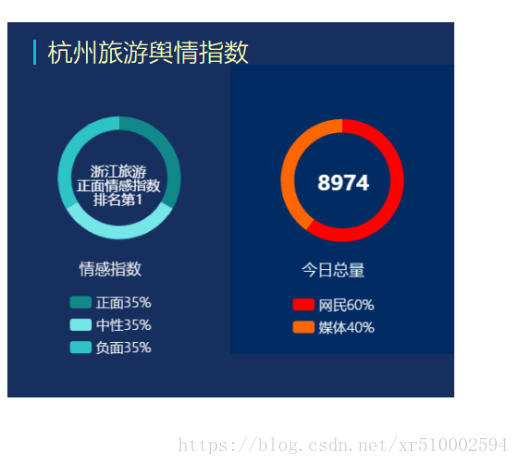
四、在echert的value值的配置中,真正的对数据的渲染,这里是对echarts的环形图进行数据渲染,这里的数据拼接处理的不好,我也没有对parseInt进行封装处理,后台给的数据是百分数,并且是个字符串类型,但是这里的value值要展示数字所有就通过slice截掉了%,然后转成数字就ok了。
data:[

{value: parseInt(this.feelingOne.feelingIndex.slice(0,2)), name:'正面'+this.feelingOne.feelingIndex},

{value: parseInt(this.feelingTwo.feelingIndex.slice(0,2)), name:'中性'+this.feelingTwo.feelingIndex},

{value: parseInt(this.feelingThree.feelingIndex.slice(0,2)), name:'负面'+this.feelingThree.feelingIndex},

]
经过不懈的努力,数据终于搞上去了。安排!但是最后data数据的渲染中写的不太好,后期再进行完善。
由于后端把服务器关了,我这边没有及时保存效果图。效果图就自己YY吧,我这里有一张样图
下面附上整体代码,下面是项目结构
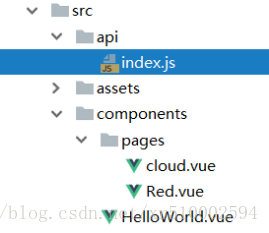
/api/index.js中
import axios from "axios";

axios.defaults.baseURL = "http://192.168.0.107:8080/option";

// 增加默认的请求的路径

axios.interceptors.response.use((res)=>{

// 在这里统一拦截结果 把结果处理成res.data.data

return res.data.data;

});

//舆情指数

export let queryfeeling = ()=> {

return axios.get("/queryfeeling")

};
HelloWord中的代码
<script>

import {queryfeeling} from "../api"

import Red from './pages/Red'

import cloud from './pages/cloud'

export default {

name: 'HelloWorld',

data () {

return {

chartData:[],

feelingOne: [],

feelingTwo: [],

feelingThree: []


}

},

created(){

this.getqueryfeeling();

},

methods : {

//axios交互

getqueryfeeling(){

queryfeeling().then((data)=>{

this.trData = data; //本来是data.data.data

//console.log(this.trData);

this.feelingOne = data[0]; //第一个data值

this.feelingTwo = data[1];

this.feelingThree = data[2];

this.ring() //本来在mounted生命周期中,但是axios是异步,所以会导致数据渲染不出来,放在请求数据之后可以保证数据完美渲染。

})

},

ring(){

// 基于准备好的dom,初始化echarts实例

console.log(parseInt(this.feelingOne.feelingIndex.slice(0,2)));

let myChart = this.$echarts.init(document.getElementById('main'));

// 指定图表的配置项和数据

myChart.title = '环形图';

let option = {

title:{

text:'情感指数',

bottom:'35%',

left:'30%',

fontSize:'15',

textStyle: {

color:'white',

fontWeight:'100'

},


},

tooltip: {//鼠标移上出现文字

trigger: 'item',

formatter: "{a} <br/>{b}: {c} ({d}%)"

},

legend: {//下面的字

orient: 'vertical',

x: '26%',

y:'68%',

textStyle: {

fontSize: '16',

fontWeight: '100',

color:'white'

},

data:['正面'+this.feelingOne.feelingIndex,'中性'+this.feelingTwo.feelingIndex,'负面'+this.feelingThree.feelingIndex]

},

graphic:{//中间字

type:'text',

left:'31%',

top:'30%',

style:{

text:'浙江旅游\n正面情感指数\n排名第1',

textAlign:'center',

fontSize:16,

fill:'#fff',

width:30,

height:30,

}

},

series: [

{

name:'旅游舆情',

type:'pie',

center:['50%','34%'],//圆环位置

radius: ['43%', '55%'],//圆环大小

avoidLabelOverlap: false,

label: {

normal: {

show: false,

position: 'center'

},

emphasis: {

show: false,

textStyle: {

fontSize: '30',

fontWeight: 'bold'

}

}

},

labelLine: {

normal: {

show: false

}

},

data:[

{value: parseInt(this.feelingOne.feelingIndex.slice(0,2)), name:'正面'+this.feelingOne.feelingIndex},

{value: parseInt(this.feelingTwo.feelingIndex.slice(0,2)), name:'中性'+this.feelingTwo.feelingIndex},

{value: parseInt(this.feelingThree.feelingIndex.slice(0,2)), name:'负面'+this.feelingThree.feelingIndex},


]

}

],

color: ['#11898a','#75e7e8','#2cc4c5',]

};

// 使用刚指定的配置项和数据显示图表。

myChart.setOption(option);

},

},


components:{Red,cloud},

}

</script>


 希望各位大佬批评指正!