本文简单地介绍了DB2中日志的使用、活动日志以及首个活动日志的概念、日志满的原因、日志满的诊断、临时处理以及避免办法
日志使用
下图显示了并发事务条件下,日志使用的示意
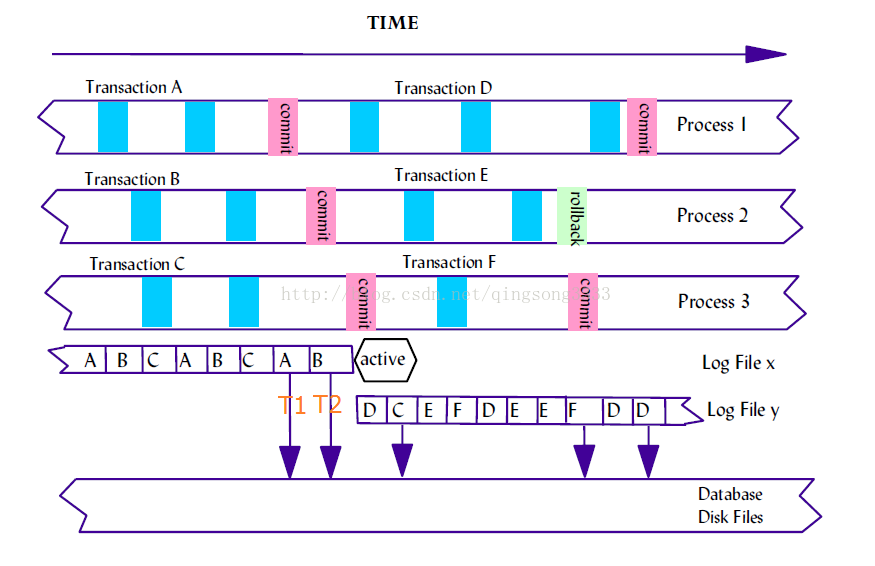
有3个并发的程序Process 1、Process 2、Process 3。每一个程序都有两个事务。蓝块代表SQL语句,红块代表commit操作,绿块代表rollback操作。每一个向下的箭头都代表日志缓冲区的数据被刷新到日志磁盘上(默认是每一次提交操作都会导致日志缓冲被刷新到磁盘上)。
在T1时刻,事务A commit,日志缓冲区被刷新到磁盘上。
在T2时刻,事务B commit,日志缓冲区被刷新到磁盘上,此时日志X使用完,但由于X中的事务C还没有提交,所以X此时还是活动日志。
在上图中,如果事务C一直没有提交操作,那么日志X将永远是首个活动日志(oldest transaction log),后续的日志也是活动日志,其他应用最终会导致日志满。
活动日志
如果一个日志中包含有未提交的事务,那么这个日志就是活动日志(也有其他情况,比如虽然所有事务已经提交,但对应的更改还没有持久化到磁盘上)。
首个活动日志(First Active Log)
第一个活动日志,首个活动日志之后的日志(也就是编号比首个活动日志大的日志)都是活动日志,可以通过数据库的snapshot查看first active log, current active log, 以及 last active log.
$ db2 get snapshot for db on sample | grep -i "File number"
File number of first active log            = 0
File number of last active log             = 2
File number of current active log          = 0

File number of log being archived          = Not applicable
日志满原因
DB2总的可用活动日志的最大空间是有限制的,当达到限制之后,就会发生日志满的问题,限制为(LOGPRIMARY + LOGSECOND) * LOGFILSIZ * 4KB
日志满的原因无非两种:
1. 一个小事务hold住了首个活动日志,一直没有提交,导致首个活动日志一直是活动状态,不被释放。这个跟堵车类似,一辆车因发动机故障(事务没有提交)堵住路口(占用首个活动日志),即使后面的车都没有问题(后续事务正常提交),也无法通过路口,且会越积越多,最终导致整个路都堵满车(日志满)。
2. 有个事务非常大,迅速用尽了所有的日志。
日志满的表现:
首先应用会报出SQL0964C错误:
$ db2 "insert into test select * from test"
DB21034E  The command was processed as an SQL statement because it was not a
valid Command Line Processor command.  During SQL processing it returned:
SQL0964C  The transaction log for the database is full.  SQLSTATE=57011
其次,db2diag.log中会有以下报错
2017-03-09-17.24.50.315000+480 E3234873F644         LEVEL: Error
PID     : 8532                 TID : 13028          PROC : db2syscs.exe
INSTANCE: DB2INST1             NODE : 000           DB   : SAMPLE
APPHDL  : 0-453                APPID: *LOCAL.DB2INST1.170309092321
AUTHID  : MIAOQINGSONG         HOSTNAME: ADMINIB-PR7US3I
EDUID   : 13028                EDUNAME: db2agent (SAMPLE)
FUNCTION: DB2 UDB, data protection services, sqlpgResSpace, probe:2860
MESSAGE : ADM1823E  The active log is full and is held by application handle
          "0-441".  Terminate this application by COMMIT, ROLLBACK or FORCE
          APPLICATION.
日志满的临时处理:
1. 可以通过增加LOGSECOND来临时增加可用的日志大小(修改时需要加上immediate选项使之立即生效);增加LOGPRIMARY并没有用,因为需要重启数据库才能生效。
2. force掉hold住首个活动日志的的应用,在force之前,可以抓取snapshot,看一下这个应用的状态:
$ db2 get snapshot for database on sample | grep -i oldest
Appl id holding the oldest transaction     = 441

$ db2 get snapshot for application agentid 441

Application Snapshot

Application handle                         = 441
Application status                         = UOW Waiting                 <<--应用状态为UOW Waiting
Status change time                         = 2017-03-09 17:23:15.068895
Application code page                      = 1386
Application country/region code            = 86
DUOW correlation token                     = *LOCAL.DB2INST1.170309092244
Application name                           = db2bp.exe
Application ID                             = *LOCAL.DB2INST1.170309092244

..

Connection request start timestamp         = 2017-03-09 17:22:44.963163  <<--应用连库时间
Connect request completion timestamp       = 2017-03-09 17:22:45.961157
Application idle time                      = 4 minutes  7 seconds


UOW log space used (Bytes)                 = 664
Previous UOW completion timestamp          = 2017-03-09 17:22:45.961157
Elapsed time of last completed uow (sec.ms)= 0.000000
UOW start timestamp                        = 2017-03-09 17:23:02.770477 <<--当前事务开始时间
UOW stop timestamp                         =                            <<--当前事务结束时间为空,说明还没有commit
UOW completion status                      =

Statement type                             = Dynamic SQL Statement
Statement                                  = Close
Section number                             = 201
Application creator                        = NULLID
Package name                               = SQLC2K26
Consistency Token                          =
Package Version ID                         =
Cursor name                                = SQLCUR201
Statement member number                    = 0
Statement start timestamp                  = 2017-03-09 17:23:15.067789
Statement stop timestamp                   = 2017-03-09 17:23:15.068893
Elapsed time of last completed stmt(sec.ms)= 0.000024
Total Statement user CPU time              = 0.000000
Total Statement system CPU time            = 0.000000
..
Dynamic SQL statement text:

select * from t1
<<--一个事务中可能有多条SQL,这个只表示当前正在执行或者最后执行过的SQL,并不能表示就是这条SQL导致了日志满,这里抓取到的是一条SELECT语句,SELECT语句不占用日志。
$ db2 "force application (441)"
DB20000I The FORCE APPLICATION command completed successfully.
DB21024I This command is asynchronous and may not be effective immediately.
日志满的避免:
1.)根据抓取到的应用的snapshot,找应用开发人员查看为何不肯提交,这才是避免问题再次出现的根本办法。
2.)从DB2管理层面,可以设置数据库配置参数max_log和num_log_span
3.)可以写脚本,以固定的间隔抓取database snapshot中的Appl id holding the oldest transaction, 如果长时间不发生变化(比如2天),就Force掉。
补充案例1:
活动日志激增排查:
DB2总的可用活动日志的最大空间是有限制的,当达到限制之后,就会发生日志满的问题,限制为(LOGPRIMARY + LOGSECOND) * LOGFILSIZ * 4KB
日志满的原因无非两种:
1. 一个小事务hold住了首个活动日志,一直没有提交,导致首个活动日志一直是活动状态,不被释放。这个跟堵车类似,一辆车因发动机故障(事务没有提交)堵住路口(占用首个活动日志),即使后面的车都没有问题(后续事务正常提交),也无法通过路口,且会越积越多,最终导致整个路都堵满车(日志满)。

2. 有个事务非常大,迅速用尽了所有的日志。
日志满的临时处理:
1. 可以通过增加LOGSECOND来临时增加可用的日志大小(修改时需要加上immediate选项使之立即生效);增加LOGPRIMARY并没有用,因为需要重启数据库才能生效。


2. force掉hold住首个活动日志的的应用,在force之前,可以抓取snapshot,看一下这个应用的状态:

db2 get snapshot for database on sample | grep -i oldest
首个活动日志(First Active Log)
第一个活动日志,首个活动日志之后的日志(也就是编号比首个活动日志大的日志)都是活动日志,可以通过数据库的snapshot查看first active log, current active log, 以及 last active log.

db2 get snapshot for db on fxyjdb|grep -i "File number"

日志有无报错

db2diag -l "Error,Servere" -H 1d

查看事务占用日志情况

db2 "select application_handle,UOW_LOG_SPACE_USED,UOW_START_TIME FROM TABLE(MON_GET_UNIT_OF_WORK(NULL,-1)) order by UOW_LOG_SPACE_USED"

快照查看最老事务

db2 get snapshot for db on fxyjdb|grep -i oldest
查询 App Handle 49379 具体事务信息
db2 get snapshot for application agentid 49379

查看当前事务

db2top -db fxyjdb

-h参数说明

输入参数a 写入App Handle 49379回车

取得相关信息包括sql语句

确认sql drop掉相关事务

db2 "force application(49379)"

再次
查看事务占用日志情况

db2 "select application_handle,UOW_LOG_SPACE_USED,UOW_START_TIME FROM TABLE(MON_GET_UNIT_OF_WORK(NULL,-1)) order by UOW_LOG_SPACE_USED"
Appl id holding the oldest transaction = 49379
http://www-01.ibm.com/support/docview.wss?uid=swg21664899
The database snapshot will show the oldest transaction.
Collect following output,
db2 get snapshot for database on <db-name>

And, look for following in the database snapshot output,
"Appl id holding the oldest transaction "
The application handle showing up against the above field have to be forced off to get the transaction log space back against that.

db2 "force application (appl-handle)"

If there are more than one application which might be causing the issue then the same step might have to be repeated multiple times forcing the current oldest transaction from that moment, until the log full situation is taken care.


Following could be run during the time of the problem to get a full picture of all the transactions,
db2pd –db <db-name> -transactions


There are some rare situations when the transaction log files might be held by indoubt transaction.

Indoubt transaction can be caused by anything using two phase commit.

The way to check indoubt transaction is to run,

db2 list indoubt transactions with prompting

and, then take necessary step to rollback or, forget the transaction.


As a permanent solution, fix the queries which might not be committing frequently enough or, increase the total log space if it's not large enough by increasing any of LOGPRIMARY, LOGSECOND or, LOGFILSZ as necessary.