介绍pandas的有关DataFrame的高级操作。
1. 数据合并
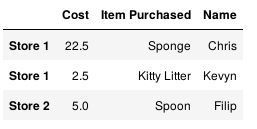
import pandas as pd

df = pd.DataFrame([{'Name': 'Chris', 'Item Purchased': 'Sponge', 'Cost': 22.50},
                   {'Name': 'Kevyn', 'Item Purchased': 'Kitty Litter', 'Cost': 2.50},
                   {'Name': 'Filip', 'Item Purchased': 'Spoon', 'Cost': 5.00}],
                  index=['Store 1', 'Store 1', 'Store 2'])
df
数据输出:
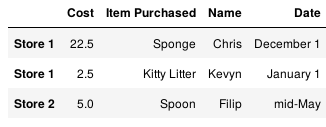
1.1 加列
df['Date'] = ['December 1', 'January 1', 'mid-May']
df
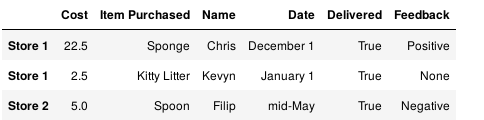
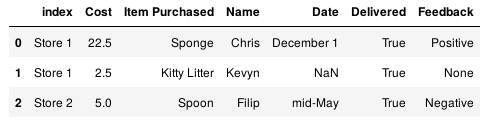
df['Delivered'] = True
df['Feedback'] = ['Positive', None, 'Negative']
重新设置某一列的值:
adf = df.reset_index()
adf['Date'] = pd.Series({0: 'December 1', 2: 'mid-May'})
adf
1.2 合并操作
staff_df = pd.DataFrame([{'Name': 'Kelly', 'Role': 'Director of HR'},
{'Name': 'Sally', 'Role': 'Course liasion'},
{'Name': 'James', 'Role': 'Grader'}])
staff_df = staff_df.set_index('Name')
student_df = pd.DataFrame([{'Name': 'James', 'School': 'Business'},
{'Name': 'Mike', 'School': 'Law'},
{'Name': 'Sally', 'School': 'Engineering'}])
student_df = student_df.set_index('Name')
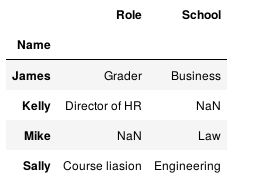
print(staff_df.head())
print()
print(student_df.head())
输出:

1.3 合并所有的值,能够自动用NaN填充
pd.merge(staff_df, student_df, how='outer', left_index=True, right_index=True)
#合并所有的值
1.4 只连接两者共有部分
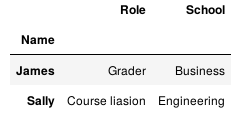
pd.merge(staff_df, student_df, how='inner', left_index=True, right_index=True)
输出:
1.5 只考虑左边部分的完整性。
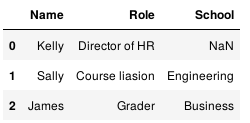
pd.merge(staff_df, student_df, how='left', left_index=True, right_index=True)

1.6 只考虑右部分的完整性。
pd.merge(staff_df, student_df, how='right', left_index=True, right_index=True)

1.7 或者按照列进行合并。
staff_df = staff_df.reset_index()
student_df = student_df.reset_index()
pd.merge(staff_df, student_df, how='left', left_on='Name', right_on='Name')
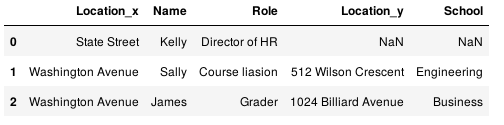
1.8 合并两个具有共同列名字的DataFrame,为了区分同名列,一般用_x表示合并操作中左边的DataFrama,_y表示右边的DataFrame。
staff_df = pd.DataFrame([{'Name': 'Kelly', 'Role': 'Director of HR', 'Location': 'State Street'},
                         {'Name': 'Sally', 'Role': 'Course liasion', 'Location': 'Washington Avenue'},
                         {'Name': 'James', 'Role': 'Grader', 'Location': 'Washington Avenue'}])
student_df = pd.DataFrame([{'Name': 'James', 'School': 'Business', 'Location': '1024 Billiard Avenue'},
                           {'Name': 'Mike', 'School': 'Law', 'Location': 'Fraternity House #22'},
                           {'Name': 'Sally', 'School': 'Engineering', 'Location': '512 Wilson Crescent'}])
pd.merge(staff_df, student_df, how='left', left_on='Name', right_on='Name')
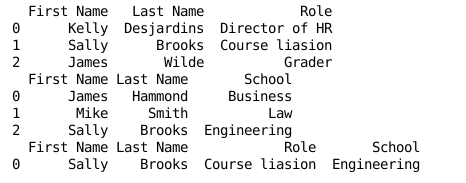
Example:
staff_df = pd.DataFrame([{'First Name': 'Kelly', 'Last Name': 'Desjardins', 'Role': 'Director of HR'},
                         {'First Name': 'Sally', 'Last Name': 'Brooks', 'Role': 'Course liasion'},
                         {'First Name': 'James', 'Last Name': 'Wilde', 'Role': 'Grader'}])
student_df = pd.DataFrame([{'First Name': 'James', 'Last Name': 'Hammond', 'School': 'Business'},
                           {'First Name': 'Mike', 'Last Name': 'Smith', 'School': 'Law'},
                           {'First Name': 'Sally', 'Last Name': 'Brooks', 'School': 'Engineering'}])
print(staff_df)
print(student_df)
print(pd.merge(staff_df, student_df, how='inner', left_on=['First Name','Last Name'], right_on=['First Name','Last Name']))
2. Pandas Idioms.
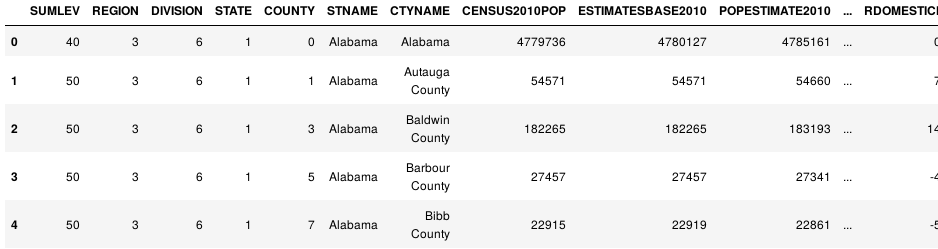
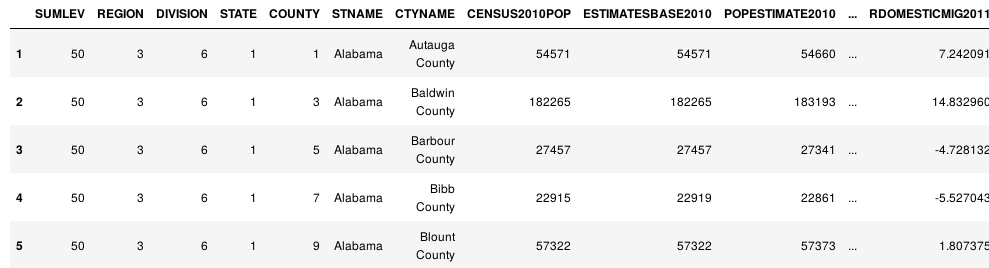
import pandas as pd
df = pd.read_csv('census.csv')
df.head()
风格1:
( df.where(df['Quantity'] != 0)
  .dropna()
  .rename(columns = {'Weight' : 'Weight(oz.)'}))
# to modify the DataFrame df in one statement to drop any entries
# where 'Quantity' is 0 and rename the column 'Weight' to 'Weight (oz.)'?.
或者用了drop()方法。效果同上。
print(df.drop(df[df['Quantity'] == 0].index).rename(columns={'Weight': 'Weight (oz.)'}))
# to modify the DataFrame df in one statement to drop any entries
# where 'Quantity' is 0 and rename the column 'Weight' to 'Weight (oz.)'?.
(df.where(df['SUMLEV']==50)
    .dropna()
    .set_index(['STNAME','CTYNAME'])
    .rename(columns={'ESTIMATESBASE2010': 'Estimates Base 2010'}))
风格2:
df = df[df['SUMLEV']==50]
df.set_index(['STNAME','CTYNAME'], inplace=True)
df.rename(columns={'ESTIMATESBASE2010': 'Estimates Base 2010'})
2.1 关于apply()方法
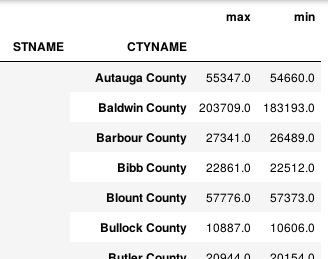
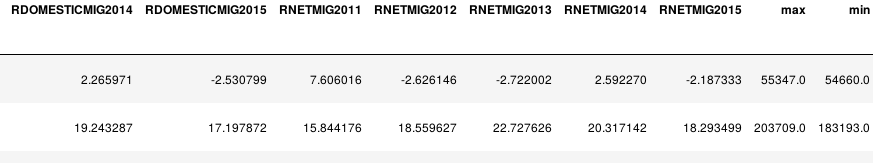
import numpy as np
def min_max(row):
    data = row[['POPESTIMATE2010',
                'POPESTIMATE2011',
                'POPESTIMATE2012',
                'POPESTIMATE2013',
                'POPESTIMATE2014',
                'POPESTIMATE2015']]
    return pd.Series({'min': np.min(data), 'max': np.max(data)})
df.apply(min_max, axis=1)
# axis 将每一行都遍历,得到每一行的最大最小值。
或者返回原来的列加min和max。
import numpy as np
def min_max(row):
    data = row[['POPESTIMATE2010',
                'POPESTIMATE2011',
                'POPESTIMATE2012',
                'POPESTIMATE2013',
                'POPESTIMATE2014',
                'POPESTIMATE2015']]
    row['max'] = np.max(data)
    row['min'] = np.min(data)
    return row
df.apply(min_max, axis=1)
或者使用lambda函数。
rows = ['POPESTIMATE2010',
        'POPESTIMATE2011',
        'POPESTIMATE2012',
        'POPESTIMATE2013',
        'POPESTIMATE2014',
        'POPESTIMATE2015']
df.apply(lambda x: np.max(x[rows]), axis=1)
3. Group by 用法
3.1 载入数据
import pandas as pd
import numpy as np
df = pd.read_csv('census.csv')
df = df[df['SUMLEV']==50]
df.head()
3.2 计算时长
unique() 方法
%%timeit -n 10
for state in df['STNAME'].unique():
    avg = np.average(df.where(df['STNAME']==state).dropna()['CENSUS2010POP'])
    print('Counties in state ' + state + ' have an average population of ' + str(avg))
# 10 loops, best of 3: 1.45 s per loop
或者groupby()方法。
%%timeit -n 10
for group, frame in df.groupby('STNAME'):
    avg = np.average(frame['CENSUS2010POP'])
    print('Counties in state ' + group + ' have an average population of ' + str(avg))
#根据state分组计算平均值
#运行时长:10 loops, best of 3: 38.1 ms per loop
或者将索引设置为groupby()需要用的索引,然后根据利用函数进行分割。
df = df.set_index('STNAME')

def fun(item):
    if item[0]<'M':
        return 0
    if item[0]<'Q':
        return 1
    return 2

for group, frame in df.groupby(fun):
    print('There are ' + str(len(frame)) + ' records in group ' + str(group) + ' for processing.')
'''
There are 1177 records in group 0 for processing.
There are 1134 records in group 1 for processing.
There are 831 records in group 2 for processing.
'''
lambda函数和apply()
print(df.groupby('Category').apply(lambda df,a,b: sum(df[a] * df[b]), 'Weight (oz.)', 'Quantity'))
# Or alternatively without using a lambda:
# def totalweight(df, w, q):
#        return sum(df[w] * df[q])
#
# print(df.groupby('Category').apply(totalweight, 'Weight (oz.)', 'Quantity'))
3.3 关于agg()方法。
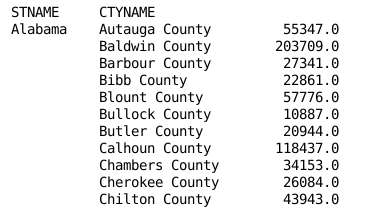
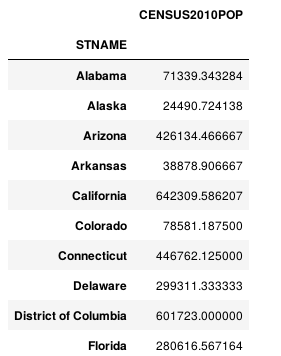
df = pd.read_csv('census.csv')
df = df[df['SUMLEV']==50]
#agg()方法的应用
df.groupby('STNAME').agg({'CENSUS2010POP': np.average})
print(type(df.groupby(level=0)['POPESTIMATE2010','POPESTIMATE2011']))
print(type(df.groupby(level=0)['POPESTIMATE2010']))
"""
<class 'pandas.core.groupby.DataFrameGroupBy'>
<class 'pandas.core.groupby.SeriesGroupBy'>
"""
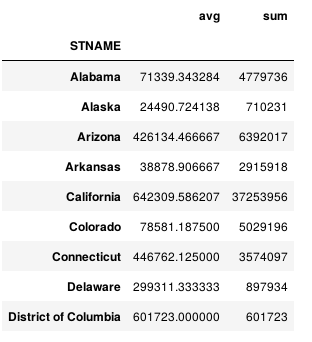
groupby 以及 .agg()
(df.set_index('STNAME').groupby(level=0)['CENSUS2010POP']
    .agg({'avg': np.average, 'sum': np.sum}))
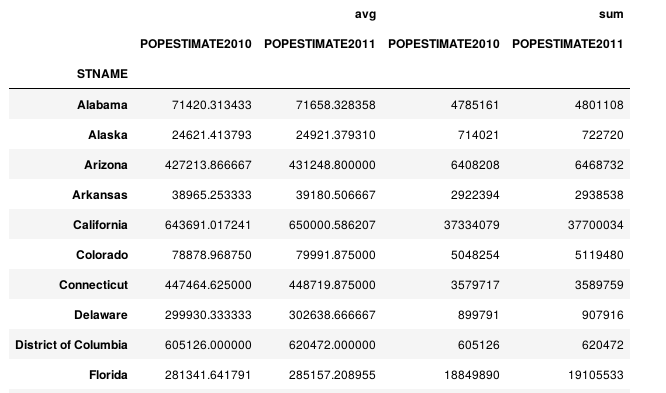
(df.set_index('STNAME').groupby(level=0)['POPESTIMATE2010','POPESTIMATE2011']
    .agg({'avg': np.average, 'sum': np.sum}))
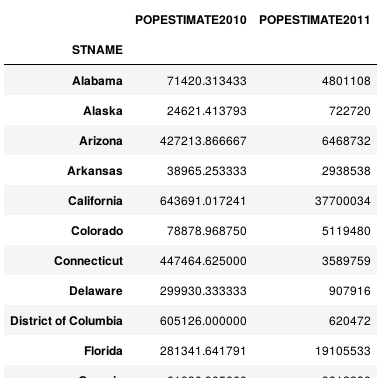
(df.set_index('STNAME').groupby(level=0)['POPESTIMATE2010','POPESTIMATE2011']
    .agg({'POPESTIMATE2010': np.average, 'POPESTIMATE2011': np.sum}))
4. Scale
4.1 对数据的排序
s = pd.Series(['Low', 'Low', 'High', 'Medium', 'Low', 'High', 'Low'])

s.astype('category', categories=['Low', 'Medium', 'High'], ordered=True)
#output:
"""
0       Low
1       Low
2      High
3    Medium
4       Low
5      High
6       Low
dtype: category
Categories (3, object): [Low < Medium < High]
"""
4.2 数据
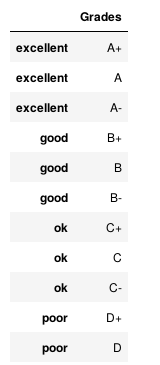
df = pd.DataFrame(['A+', 'A', 'A-', 'B+', 'B', 'B-', 'C+', 'C', 'C-', 'D+', 'D'],
                  index=['excellent', 'excellent', 'excellent', 'good', 'good', 'good', 'ok', 'ok', 'ok', 'poor', 'poor'])
df.rename(columns={0: 'Grades'}, inplace=True)
df
df['Grades'].astype('category').head()
#显示
"""
excellent    A+
excellent     A
excellent    A-
good         B+
good          B
Name: Grades, dtype: category
Categories (11, object): [A, A+, A-, B, ..., C+, C-, D, D+]
"""
排序:
grades = df['Grades'].astype('category',
                             categories=['D', 'D+', 'C-', 'C', 'C+', 'B-', 'B', 'B+', 'A-', 'A', 'A+'],
                             ordered=True)
grades.head()
#output:
"""
excellent    A+
excellent     A
excellent    A-
good         B+
good          B
Name: Grades, dtype: category
Categories (11, object): [D < D+ < C- < C ... B+ < A- < A < A+]
"""
比较
grades > 'C'
"""
excellent     True
excellent     True
excellent     True
good          True
good          True
good          True
ok            True
ok           False
ok           False
poor         False
poor         False
Name: Grades, dtype: bool
"""
4.3 pd.cut()方法分成多个区间。
df = pd.read_csv('census.csv')
df = df[df['SUMLEV']==50]
df = df.set_index('STNAME').groupby(level=0)['CENSUS2010POP'].agg({'avg': np.average})

pd.cut(df['avg'],3).head()
"""
STNAME
Alabama       (11706.0871, 222327.236]
Alaska        (11706.0871, 222327.236]
Arizona       (222327.236, 432318.411]
Arkansas      (11706.0871, 222327.236]
California    (432318.411, 642309.586]
Name: avg, dtype: category
Categories (3, object): [(11706.0871, 222327.236] < (222327.236, 432318.411] < (432318.411, 642309.586]]
"""
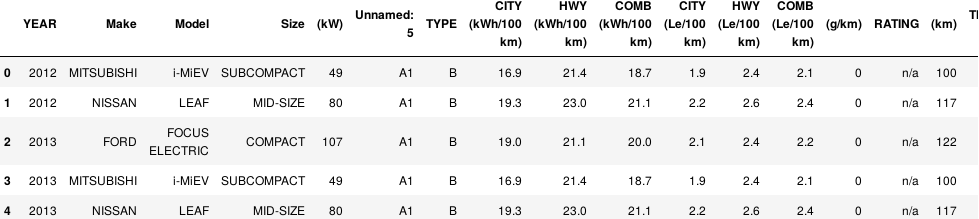
5. Pivot Tables.
df = pd.read_csv('cars.csv')
df
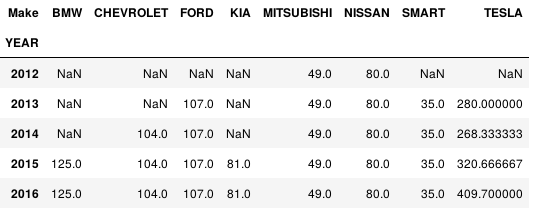
df.pivot_table(values='(kW)', index='YEAR', columns='Make', aggfunc=np.mean)
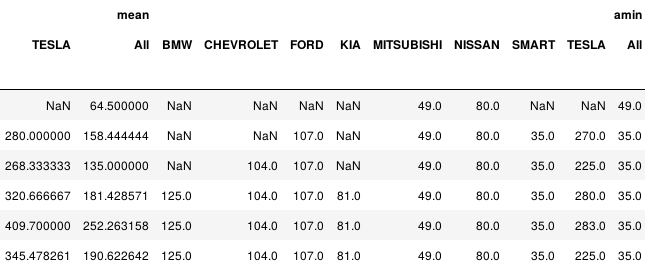
或者用多个aggfunc函数
df.pivot_table(values='(kW)', index='YEAR', columns='Make', aggfunc=[np.mean,np.min], margins=True)