转自:https://blog.csdn.net/xuyingjie125/article/details/78417760
本人计算机小白一枚,将自己学到的知识点整理出来,一方面是对自己学习的小总结,另一方面是欢迎大家批评指正。如果觉得写得还可以,大家可以转发关注此博客,谢谢!后续会有新算法持续更新~.
一.混淆矩阵
(一).简介
在人工智能中,混淆矩阵(confusion matrix)是可视化工具,特别用于监督学习,在无监督学习一般叫做匹配矩阵。在图像精度评价中,主要用于比较分类结果和实际测得值,可以把分类结果的精度显示在一个混淆矩阵里面。混淆矩阵是通过将每个实测像元的位置和分类与分类图像中的相应位置和分类像比较计算的。
混淆矩阵(confusion matrix)刻画一个分类器的分类准确程度。“混淆”一词也形象地表达了分类器面对多个分类时可能造成的混淆。
(二).混淆矩阵(Confusion Matrix)举例说明
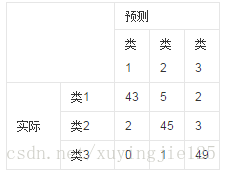
混淆矩阵的每一列代表了预测类别,每一列的总数表示预测为该类别的数据的数目;每一行代表了数据的真实归属类别,每一行的数据总数表示该类别的数据实例的数目。每一列中的数值表示真实数据被预测为该类的数目:如下图,第一行第一列中的43表示有43个实际归属第一类的实例被预测为第一类,同理,第二行第一列的2表示有2个实际归属为第二类的实例被错误预测为第一类。
举例如下:
如有150个样本数据,这些数据分成3类,每类50个。分类结束后得到的混淆矩阵为:
每一行之和为50,表示50个样本;
第一行说明类1的50个样本有43个分类正确,5个错分为类2,2个错分为类3。
二.混淆矩阵的MATLAB实现
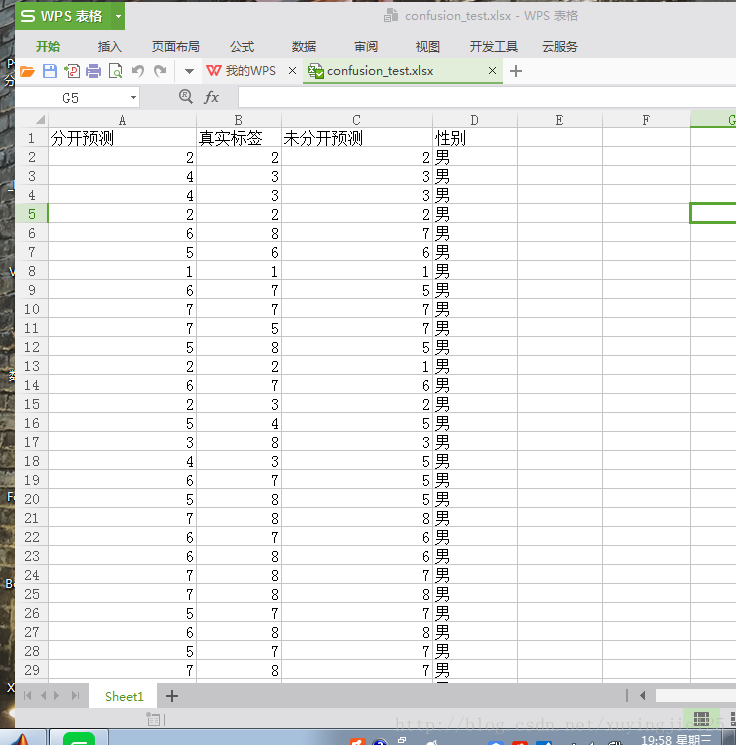
(一).数据集如下:
(二).MATLAB实现
1.confusion_matrix1.m文件(在下面主函数中直接调用)
%==========================================================
function confusion_matrix1(act1,det1)

[mat,order] = confusionmat(act1,det1);
k=max(order);             %k为分类的个数

%也可作实验,自己随机产生矩阵
%mat = rand(5);  %# A 5-by-5 matrix of random values from 0 to 1
%mat(3,3) = 0;   %# To illustrate
%mat(5,2) = 0;   %# To illustrate

imagesc(mat); %# Create a colored plot of the matrix values
colormap(flipud(gray));  %# Change the colormap to gray (so higher values are

%#black and lower values are white)
title('不分性别的分开预测标签与真实标签的混淆矩阵');
textStrings = num2str(mat(:),'%0.02f');       %# Create strings from the matrix values
textStrings = strtrim(cellstr(textStrings));  %# Remove any space padding

%% ## New code: ###这里是不显示小矩阵块里的0,用空白代替
% idx = strcmp(textStrings(:), '0.00');
% textStrings(idx) = {'   '};
%% ################

%# Create x and y coordinates for the strings %meshgrid是MATLAB中用于生成网格采样点的函数
[x,y] = meshgrid(1:k);
hStrings=text(x(:),y(:),textStrings(:),'HorizontalAlignment','center');
midValue = mean(get(gca,'CLim'));  %# Get the middle value of the color range
textColors = repmat(mat(:) > midValue,1,3);  %# Choose white or black for the
                                             %#   text color of the strings so
                                             %#   they can be easily seen over
                                             %#   the background color
%将矩阵[mat(:) >midValue]复制1X3块的矢量(颜色值必须为包含3个元素的数值矢量),即把矩阵[mat(:) > midValue]作为矩阵textColors的元素。
set(hStrings,{'Color'},num2cell(textColors,2));  %# Change the text colors;
%num2cell(textColors, 2)中2 代表「直行被切割」将结构阵列转换成异质阵列 将结构阵列转换成异质阵列;
%然后set去重后放在hStrings;

%下面这个数字8可根据自己的分类需求进行更改
set(gca,'XTick',1:8,...
        'XTickLabel',{'1','2','3','4','5','6','7',8'},...  %#   and tick labels
        'YTick',1:8,...                                    %同上
        'YTickLabel',{'1','2','3','4','5','6','7',8'},...
        'TickLength',[0 0]);
%==========================================================
- 1
- 2
- 3
- 4
- 5
- 6
- 7
- 8
- 9
- 10
- 11
- 12
- 13
- 14
- 15
- 16
- 17
- 18
- 19
- 20
- 21
- 22
- 23
- 24
- 25
- 26
- 27
- 28
- 29
- 30
- 31
- 32
- 33
- 34
- 35
- 36
- 37
- 38
- 39
- 40
- 41
- 42
- 43
- 44
- 45
- 46
2.主函数main.m
a=xlsread('confusion_test.xls');
%========================================
%真实标签:
act=a(1:194,2:2);
act1=act';
%性别为男生的分开预测的标签
det=a(1:194,1:1);
det1=det';
%性别为男生的未分开预测的标签
dett=a(1:194,3:3);
dett1=dett';
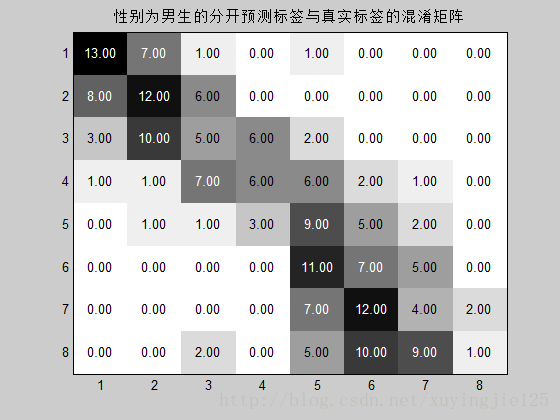
%这里调用confusion_matrix1()函数求的是‘性别为男生的分开预测的标签与真真实标签的混淆矩阵’
confusion_matrix1(act1,det1)
%==========================================================- 1
- 2
- 3
- 4
- 5
- 6
- 7
- 8
- 9
- 10
- 11
- 12
- 13
- 14
- 15
- 16
注意:上述程序只需要在confusion_matrix1.m文件中将含有(act1,det1)的参数改成自己需要求的参数,然后在主程序中调用此函数就OK了!(代码可复制直接运行)
3.运行结果:
参考文献:
[1].https://baike.baidu.com/item/%E6%B7%B7%E6%B7%86%E7%9F%A9%E9%98%B5/10087822?fr=aladdin
[2].http://blog.csdn.net/songchaomail/article/details/43834741/
[3].http://blog.csdn.net/zhaomengszu/article/details/56283832