简介
echarts中的三维地球,需要用到世界地图json数据,我把json文件放到我的资源中,有需要的自行下载。
安装插件
// 安装echats
npm install echarts --save
npm install echarts-gl --save
项目中引用
1,引入安装的echarts插件
import * as echarts from 'echarts';
import 'echarts-gl';
2,引入世界地图json文件
import WorldJSON from './world.json'3,echarts 注册世界地图
//注册世界地图
echarts.registerMap('world', WorldJSON);
绘制3d地球代码
// 绘制3d echarts图表
function draw3Dcharts() {
let myChart = echarts.init(map.value);
let geoCoordMap = {
"海门": [121.15, 31.89],
"鄂尔多斯": [109.781327, 39.608266],
"菏泽": [115.480656, 35.23375],
"合肥": [117.27, 31.86],
"武汉": [114.31, 30.52],
"大庆": [125.03, 46.58]
};
var alirl = [
[[121.15, 31.89], [121.48, 31.22]],
[[120.38, 37.35], [121.48, 31.22]],
[[123.97, 47.33], [121.48, 31.22]],
[[118.87, 42.28], [121.48, 31.22]],
[[121.52, 36.89], [121.48, 31.22]],
[[102.18, 38.52], [121.48, 31.22]],
[[118.58, 24.93], [121.48, 31.22]],
[[120.53, 36.86], [121.48, 31.22]],
[[119.46, 35.42], [121.48, 31.22]],
[[119.97, 35.88], [121.48, 31.22]],
[[121.05, 32.08], [121.48, 31.22]],
[[ 91.11, 29.97], [121.48, 31.22]]
]
var convertData = function (data) {
var res = [];
for (var i = 0; i < data.length; i++) {
var geoCoord = geoCoordMap[data[i].name];
if (geoCoord) {
res.push({
name: data[i].name,
value: geoCoord.concat(data[i].value)
});
}
}
return res;
};
var baseTexture = null
// 生成球面纹理
function getBaseTexture() {
let canvas = document.createElement('canvas');
baseTexture = echarts.init(canvas, null , {
width: 4096,
height: 2048,
});
baseTexture.setOption({
backgroundColor: '#001213',
series: [
{
type: 'map',
map: 'world',
left: 0,
top: 0,
right: 0,
bottom: 0,
roam:true,
boundingCoords: [
[-180, 90],
[180, -90],
],
label: {
show: false,
color: '#fff',
fontSize: 20,
},
itemStyle: {
areaColor: '#004444',
borderColor: '#00cccc',
borderWidth: 2,
},
},
],
});
drawEarth();
}
function drawEarth() {
let option = {
tooltip: {
show: true,
},
globe: {
silent: true,
shading: 'color',
environment: '#000',
baseTexture: baseTexture,
viewControl: {
rotateSensitivity: 3, //鼠标旋转灵敏度,设置为0后无法旋转。
zoomSensitivity: 0,//鼠标缩放灵敏度
autoRotate: true,//自动旋转
autoRotateAfterStill: 1,//鼠标停止后多久恢复旋转(为0时暂停后不恢复旋转)
//alpha:160,//视角绕 x 轴,即上下旋转的角度
//beta:-20,//视角绕 y 轴,即左右旋转的角度。
// targetCoord: [75.508268, 18.247872] //定位到哪里
// 定位到北京
targetCoord: [116.46, 39.92],
}
},
series: [
//柱状图
{
type: "bar3D",
coordinateSystem: 'globe',
barSize: 0.5, //柱子粗细
shading: 'lambert',
opacity: 1,
bevelSize: 0.2,
itemStyle: {
color: '#EBE806',
opacity: 0.1
},
label: {
show: false,
formatter: '{b}'
},
data: convertData([
{
name: "海门",
value: (Math.random() * 300).toFixed(2)
}, {
name: "鄂尔多斯",
value: (Math.random() * 300).toFixed(2)
}, {
name: "招远",
value: (Math.random() * 300).toFixed(2)
}, {
name: "舟山",
value: (Math.random() * 300).toFixed(2)
}, {
name: "齐齐哈尔",
value: (Math.random() * 300).toFixed(2)
}, {
name: "盐城",
value: (Math.random() * 300).toFixed(2)
}, {
name: "赤峰",
value: (Math.random() * 300).toFixed(2)
}
]),
},
{
name: 'lines3D',
type: 'lines3D',
coordinateSystem: 'globe',
effect: {
show: true,
period: 2,
trailWidth: 3,
trailLength: 0.5,
trailOpacity: 1,
trailColor: '#0087f4'
},
blendMode: 'lighter',
lineStyle: {
// width: 2
width: 1,
color: '#0087f4',
opacity: 0
},
data: [],
silent: false,
},
{
type: 'lines3D',
coordinateSystem: 'globe',
effect: {
show: true,
trailWidth: 5,
trailOpacity: 1,
trailLength: 0.2,
constantSpeed: 5
},
blendMode: 'lighter',
lineStyle: { //航线的视图效果
color: '#EBE806',
width: 1,
opacity: 1
},
data: alirl
}
]
};
for (let i = 0; i < 50; i++) {
option.series[1].data = option.series[1].data.concat(rodamData())
}
myChart.clear();
myChart.setOption(option, true);
window.addEventListener('resize', () => {
myChart.resize();
});
}
function rodamData() {
let longitude = 105.18
let longitude2 = Math.random() * 360 - 180
let latitude = 37.51
let latitude2 = Math.random() * 180 - 90
return {
coords: [
[longitude2, latitude2],
[longitude, latitude]
],
value: (Math.random() * 3000).toFixed(2)
}
}
getBaseTexture();
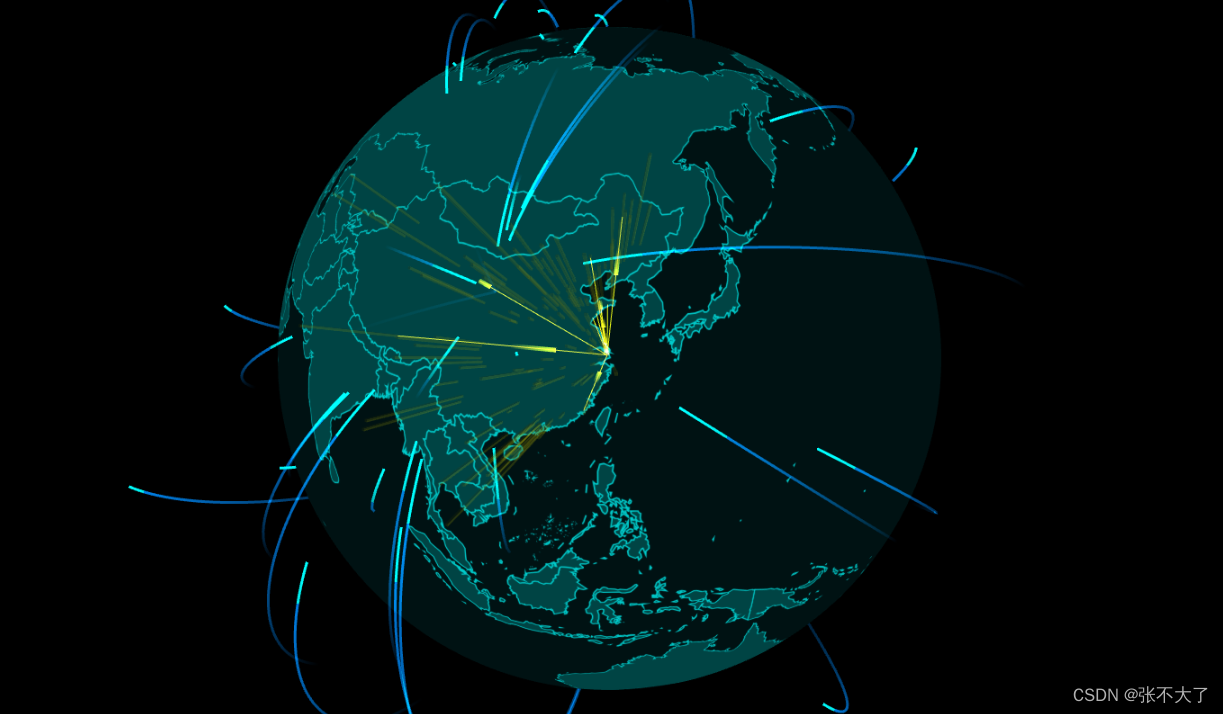
}效果图展示