elementUI的el-table横向展示,表头根据数据变化。
图示: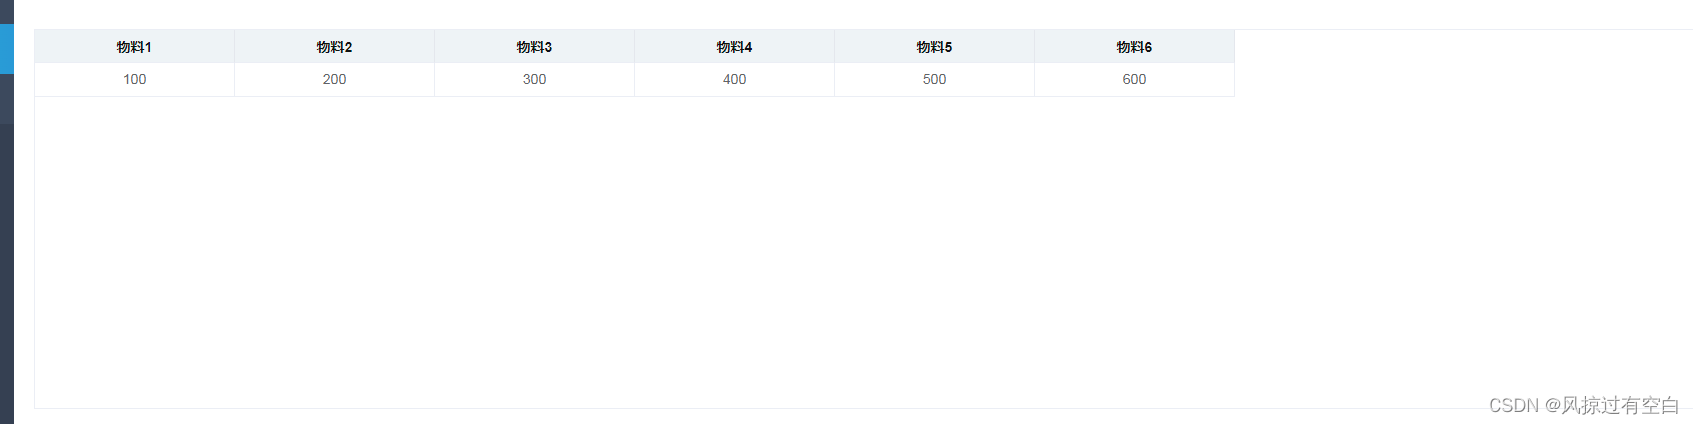
代码:
   <el-table
        :data="tableData"
        height="3.8rem"
        ref="table"
        border>
      <el-table-column
          v-for="(item,index) in tableHead"
          :prop="item.inventoryQtyByTon"
          :key="index"
          :width="tableHead.length>5?200:''"
          :label="item.lspzName">
      </el-table-column>
    </el-table>
 tableData: [],
 tableHead: [],
           let list=[{


              inventoryQtyByTon:100,
              lspzName:'物料1'
            },{


              inventoryQtyByTon:200,
              lspzName:'物料2'
            },{


              inventoryQtyByTon:300,
              lspzName:'物料3'
            },{


              inventoryQtyByTon:400,
              lspzName:'物料4'
            },{


              inventoryQtyByTon:500,
              lspzName:'物料5'
            },{


              inventoryQtyByTon:600,
              lspzName:'物料6'
            }]
            this.getCrosswise(list)
    //横向表格数据
    getCrosswise(list){


      let dataObj = {

    }
      list.map((e,index)=>{


        dataObj['inventoryQtyByTon' + index] = e.inventoryQtyByTon
        this.tableHead.push({


          lspzName:e.lspzName,
          inventoryQtyByTon:'inventoryQtyByTon' + index
        })
      })
      this.tableData.push(dataObj)
    },