var dataAll = [
[
[10.0, 8.04],
[8.0, 6.95],
[13.0, 7.58],
[9.0, 8.81],
[11.0, 8.33],
[14.0, 9.96],
[6.0, 7.24],
[4.0, 4.26],
[12.0, 10.84],
[7.0, 4.82],
[5.0, 5.68]
],
[
[10.0, 9.14],
[8.0, 8.14],
[13.0, 8.74],
[9.0, 8.77],
[11.0, 9.26],
[14.0, 8.10],
[6.0, 6.13],
[4.0, 3.10],
[12.0, 9.13],
[7.0, 7.26],
[5.0, 4.74]
],
[
[10.0, 7.46],
[8.0, 6.77],
[13.0, 12.74],
[9.0, 7.11],
[11.0, 7.81],
[14.0, 8.84],
[6.0, 6.08],
[4.0, 5.39],
[12.0, 8.15],
[7.0, 6.42],
[5.0, 5.73]
],
[
[8.0, 6.58],
[8.0, 5.76],
[8.0, 7.71],
[8.0, 8.84],
[8.0, 8.47],
[8.0, 7.04],
[8.0, 5.25],
[19.0, 12.50],
[8.0, 5.56],
[8.0, 7.91],
[8.0, 6.89]
]
];
var markLineOpt = {
animation: false,
label: {
normal: {
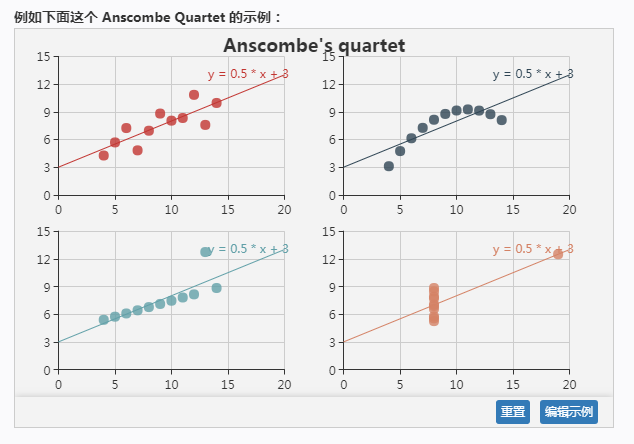
formatter: 'y = 0.5 * x + 3',
textStyle: {
align: 'right'
}
}
},
lineStyle: {
normal: {
type: 'solid'
}
},
tooltip: {
formatter: 'y = 0.5 * x + 3'
},
data: [[{
coord: [0, 3],
symbol: 'none'
}, {
coord: [20, 13],
symbol: 'none'
}]]
};
option = {
title: {
text: 'Anscombe\'s quartet',
x: 'center',
y: 0
},
grid: [
/*38% 宽度图表刚好不接触*/
/*左上*/
{x: '7%', y: '7%', width: '38%', height: '38%'},
/*右上*/
{x2: '7%', y: '7%', width: '38%', height: '38%'},
/*左下*/
{x: '7%', y2: '7%', width: '38%', height: '38%'},
/*右下*/
{x2: '7%', y2: '7%', width: '38%', height: '38%'}
],
tooltip: {
formatter: 'Group {a}: ({c})'
},
xAxis: [
{gridIndex: 0, min: 0, max: 20},
{gridIndex: 1, min: 0, max: 20},
{gridIndex: 2, min: 0, max: 20},
{gridIndex: 3, min: 0, max: 20}
],
yAxis: [
{gridIndex: 0, min: 0, max: 15},
{gridIndex: 1, min: 0, max: 15},
{gridIndex: 2, min: 0, max: 15},
{gridIndex: 3, min: 0, max: 15}
],
series: [
{
name: 'I',
type: 'scatter',
xAxisIndex: 0,
yAxisIndex: 0,
data: dataAll[0],
markLine: markLineOpt
},
{
name: 'II',
type: 'scatter',
xAxisIndex: 1,
yAxisIndex: 1,
data: dataAll[1],
markLine: markLineOpt
},
{
name: 'III',
type: 'scatter',
xAxisIndex: 2,
yAxisIndex: 2,
data: dataAll[2],
markLine: markLineOpt
},
{
name: 'IV',
type: 'scatter',
xAxisIndex: 3,
yAxisIndex: 3,
data: dataAll[3],
markLine: markLineOpt
}
]
};
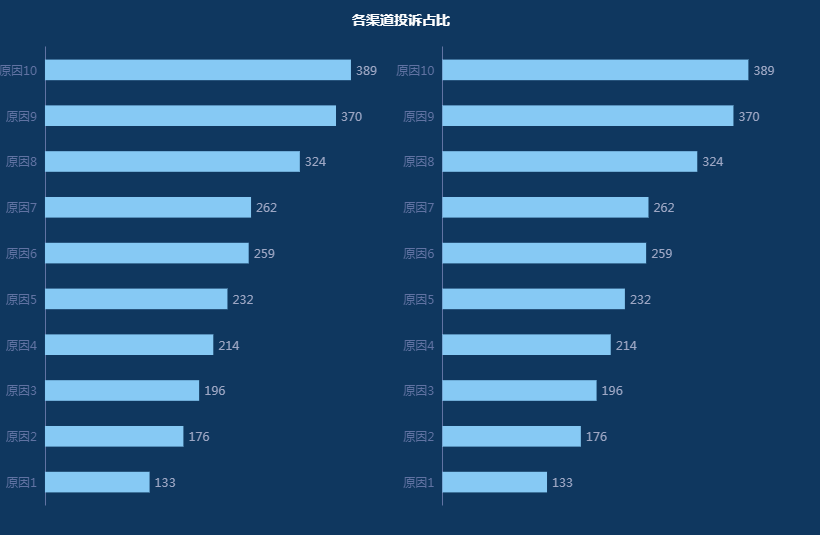
左右均匀分布
var dataAll = [389, 259, 262, 324, 232, 176, 196, 214, 133, 370];
var yAxisData = ['原因1', '原因2', '原因3', '原因4', '原因5', '原因6', '原因7', '原因8', '原因9', '原因10'];
var option = {
    backgroundColor: '#0f375f',
    title: [{
        text: "各渠道投诉占比",
        x: 'center',
        y: 0,
        textStyle: {
            color: "#fff",
            fontSize: "14"

        }
    }, ],
    grid: [{
            x: '7%',
            y: '7%',
            width: '38%'
        },
        {
            x2: '7%',
            y: '7%',
            width: '38%'
        },
    ],
    tooltip: {
        formatter: '{b} ({c})'
    },
    xAxis: [{
            gridIndex: 0,
            axisTick: {
                show: false
            },
            axisLabel: {
                show: false
            },
            splitLine: {
                show: false
            },
            axisLine: {
                show: false
            }
        },
        {
            gridIndex: 1,
            axisTick: {
                show: false
            },
            axisLabel: {
                show: false
            },
            splitLine: {
                show: false
            },
            axisLine: {
                show: false
            }
        },
    ],
    yAxis: [{
        gridIndex: 0,
        interval: 0,
        data: yAxisData.reverse(),
        axisTick: {
            show: false
        },
        axisLabel: {
            show: true
        },
        splitLine: {
            show: false
        },
        axisLine: {
            show: true,
            lineStyle: {
                color: "#6173a3"
            }
        },
    }, {
        gridIndex: 1,
        interval: 0,
        data: yAxisData.reverse(),
        axisTick: {
            show: false
        },
        axisLabel: {
            show: true
        },
        splitLine: {
            show: false
        },
        axisLine: {
            show: true,
            lineStyle: {
                color: "#6173a3"
            }
        },
    }],
    series: [

        {
            name: '投诉原因TOP10',
            type: 'bar',
            xAxisIndex: 0,
            yAxisIndex: 0,
            barWidth: '45%',
            itemStyle: {
                normal: {
                    color: '#86c9f4'
                }
            },
            label: {
                normal: {
                    show: true,
                    position: "right",
                    textStyle: {
                        color: "#9EA7C4"
                    }
                }
            },
            data: dataAll.sort(),
        }, {
            name: '各渠道投诉占比',
            type: 'bar',
            xAxisIndex: 1,
            yAxisIndex: 1,
            barWidth: '45%',
            itemStyle: {
                normal: {
                    color: '#86c9f4'
                }
            },
            label: {
                normal: {
                    show: true,
                    position: "right",
                    textStyle: {
                        color: "#9EA7C4"
                    }
                }
            },
            data: dataAll.sort(),
        },

    ]
};